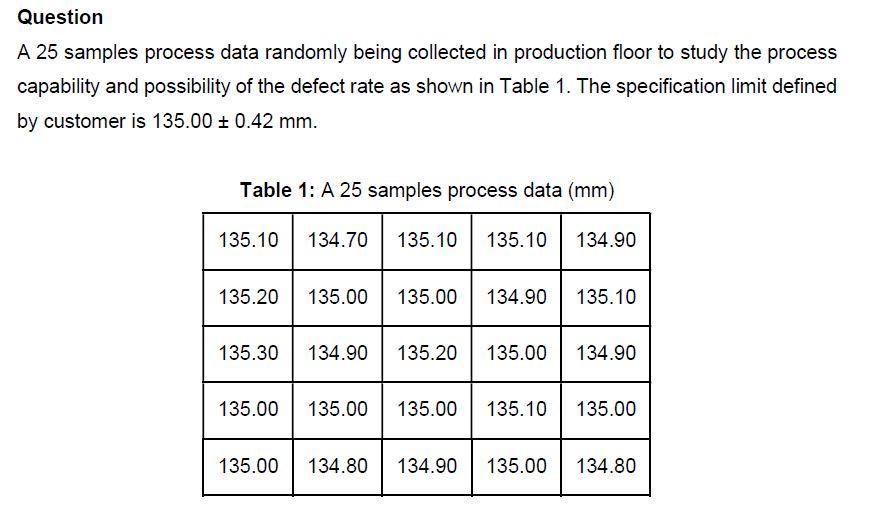
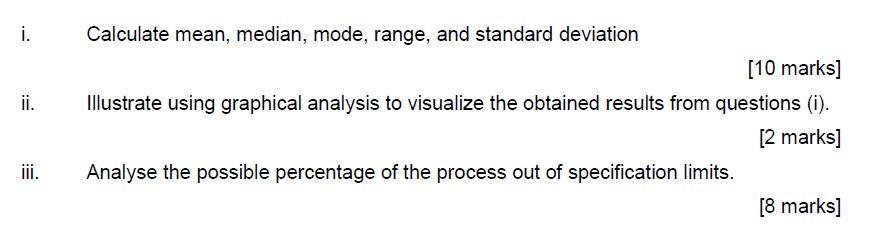
Question: Question A 25 samples process data randomly being collected in production floor to study the process capability and possibility of the defect rate as shown

Question A 25 samples process data randomly beingQuestion A 25 samples process data randomly being

Question A 25 samples process data randomly being collected in production floor to study the process capability and possibility of the defect rate as shown in Table 1. The specification limit defined by customer is 135.00 : 0.42 mm. Table 1: A 25 samples process data (mm) 135.10 134.70 135.10 135.10 134.90 135.20 135.00 134.90 135.10 135.00 5.20 135.00 135.30 134.90 134.90 135.00 135.00 135.00 135.10 135.00 135.00 134.80 134.90 135.00 134.80 i. ii. Calculate mean, median, mode, range, and standard deviation [10 marks] Illustrate using graphical analysis to visualize the obtained results from questions (1). [2 marks] Analyse the possible percentage of the process out of specification limits. [8 marks]

Step by Step Solution

There are 3 Steps involved in it

1 Expert Approved Answer
Step: 1 Unlock blur-text-image
Question Has Been Solved by an Expert!

Get step-by-step solutions from verified subject matter experts

Step: 2 Unlock
Step: 3 Unlock

Students Have Also Explored These Related General Management Questions!