

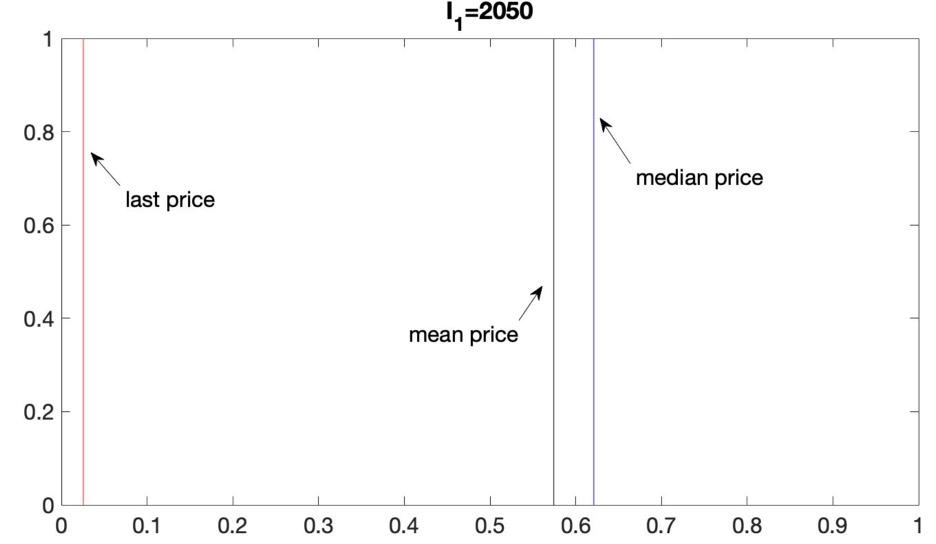
Question: Question: a) Draw your conclusions based on what you learned under figureI_1. and figure I_2. Explain the meaning of variables 'I_1' and 'I_2' after you
Question:
a) Draw your conclusions based on what you learned under figureI_1. and figure I_2.
Explain the meaning of variables 'I_1' and 'I_2' after you execute (after datasett.csv is loaded in R or Octave)
imported_data
S=imported_data[,5]-imported_data[,3]
b) After loading dataset.csv into R (or software of your choice), explain the meaning of each column or what the attributes explain. Columns are for skewness, median, mean, standard deviation, and the last price (each row describes with the numbers the distribution of the stock prices):
c) If you want to decide, based on the historical data, which row (stock) to buy or sell, would you base your decision on skewness attribute (1st column) or the differences between the last prices with mean (differences between 5th attribute and 3rd attribute)? Explain.
d) Show a simple example of how to calculate variance and then explain the meaning of it.
and
Show a simple example of how to calculate skewness and then explain the meaning of it.
DATASET
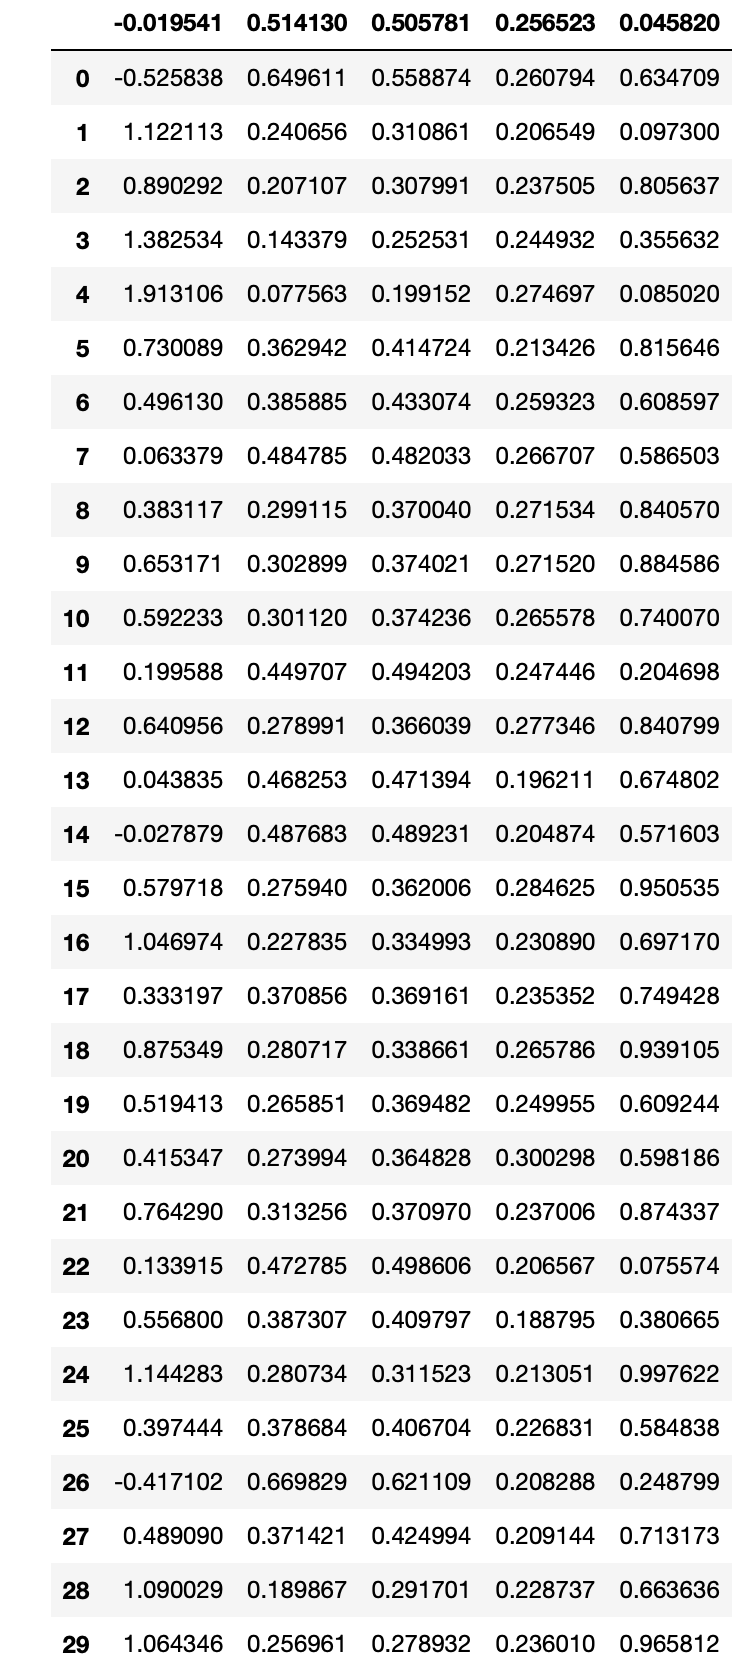
FIGURE I_1 and FIGURE I_2
![you execute (after datasett.csv is loaded in R or Octave) imported_data S=imported_data[,5]-imported_data[,3]](https://dsd5zvtm8ll6.cloudfront.net/si.experts.images/questions/2024/09/66ef7a5f05723_46266ef7a5e92d3e.jpg)
Step by Step Solution
There are 3 Steps involved in it

Get step-by-step solutions from verified subject matter experts