

Question: Question a. How does Michellin's average compound growth rate in sales compare with its earnings growth over the past five years? Assets Cash and Marketable
Question
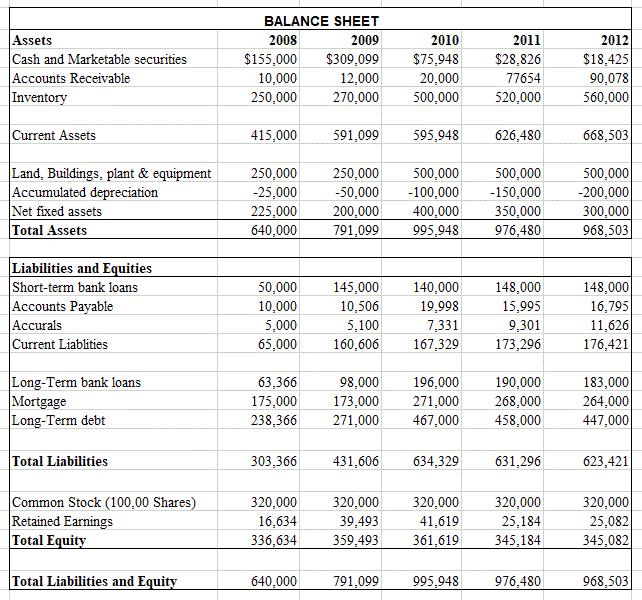
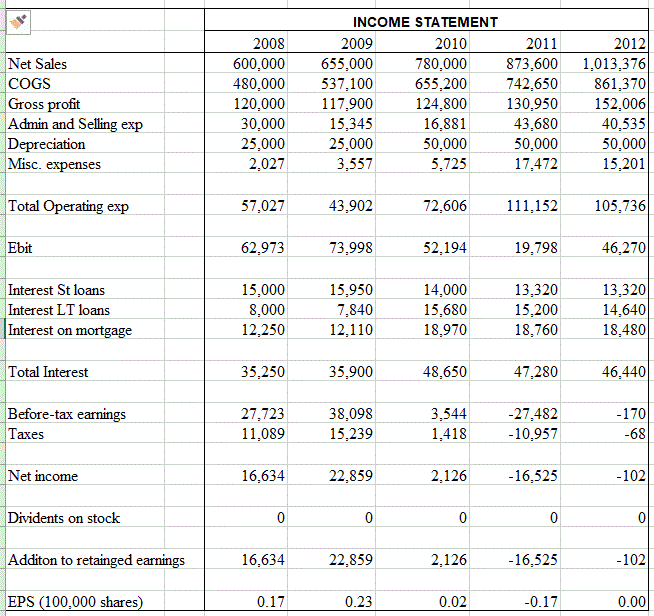
a. How does Michellin's average compound growth rate in sales compare with its earnings growth over the past five years?
Assets Cash and Marketable securities Accounts Receivable Inventory BALANCE SHEET 2008 2009 $155,000 $309,099 10,000 12,000 250,000 270.000 2010 $75,948 20,000 500,000 2011 $28,826 77654 520,000 2012 $18,425 90,078 560,000 Current Assets 415,000 591,099 595,948 626,480 668,503 Land, Buildings, plant & equipment Accumulated depreciation Net fixed assets Total Assets 250,000 -25,000 225,000 640,000 250,000 -50,000 200.000 791,099 500,000 -100,000 400,000 995,948 500.000 -150,000 350,000 976,480 500,000 -200,000 300,000 968,503 Liabilities and Equities Short-term bank loans Accounts Payable Accurals Current Liablities 50,000 10,000 5,000 65,000 145,000 10,506 5,100 160,606 140,000 19,998 7,331 167,329 148,000 15,995 9.301 173,296 148,000 16,795 11,626 176,421 Long-Term bank loans Mortgage Long-Term debt 63,366 175,000 98,000 173,000 271,000 196,000 271,000 467,000 190.000 268,000 458,000 183.000 264,000 447,000 238.366 Total Liabilities 303,366 431,606 634,329 631,296 623,421 Common Stock (100,00 Shares) Retained Earnings Total Equity 320,000 16,634 336,634 320,000 39,493 359,493 320,000 41,619 361,619 320,000 25,184 345,184 320,000 25,082 345,082 Total Liabilities and Equity 640,000 791,099 995,948 976,480 968,503 2012 Net Sales COGS Gross profit Admin and Selling exp Depreciation Misc. expenses 2008 600,000 480,000 120.000 30,000 25,000 2.027 INCOME STATEMENT 2009 2010 2011 655,000 780,000 873,600 537,100 655,200 742,650 117,900 124.800 130.950 15,345 16,881 43.680 25,000 50.000 50.000 3,557 5,725 17,472 1,013,376 861,370 152.006 40,535 50,000 15,201 Total Operating exp 57,027 43,902 72,606 111,152 105,736 Ebit 62,973 73.998 52,194 19,798 46.270 Interest St loans Interest LT loans Interest on mortgage 15,000 8.000 12.250 15,950 7,840 12.110 14.000 15,680 18,970 13,320 15,200 18.760 13,320 14,640 18.480 Total Interest 35,250 35.900 48,650 47,280 46.4401 Before-tax earnings 27,723 11,089 38.098 15,239 3,544 1.418 -27.482 -10.957 -170 -68 Taxes Net income 16,634 22.859 2.126 -16,525 -102 Dividents on stock Additon to retainged earnings 16,634 22,859 2,126 -16,525 -102 EPS (100,000 shares) 0.17 0.23 0.02 -0.17 0.00
Step by Step Solution
There are 3 Steps involved in it

Get step-by-step solutions from verified subject matter experts