

Question: Question about data analysis Uvab x x A LA AO E= = = F EV OF . CATEGORICAL DATA Circle graphs are good for showing
Question about data analysis
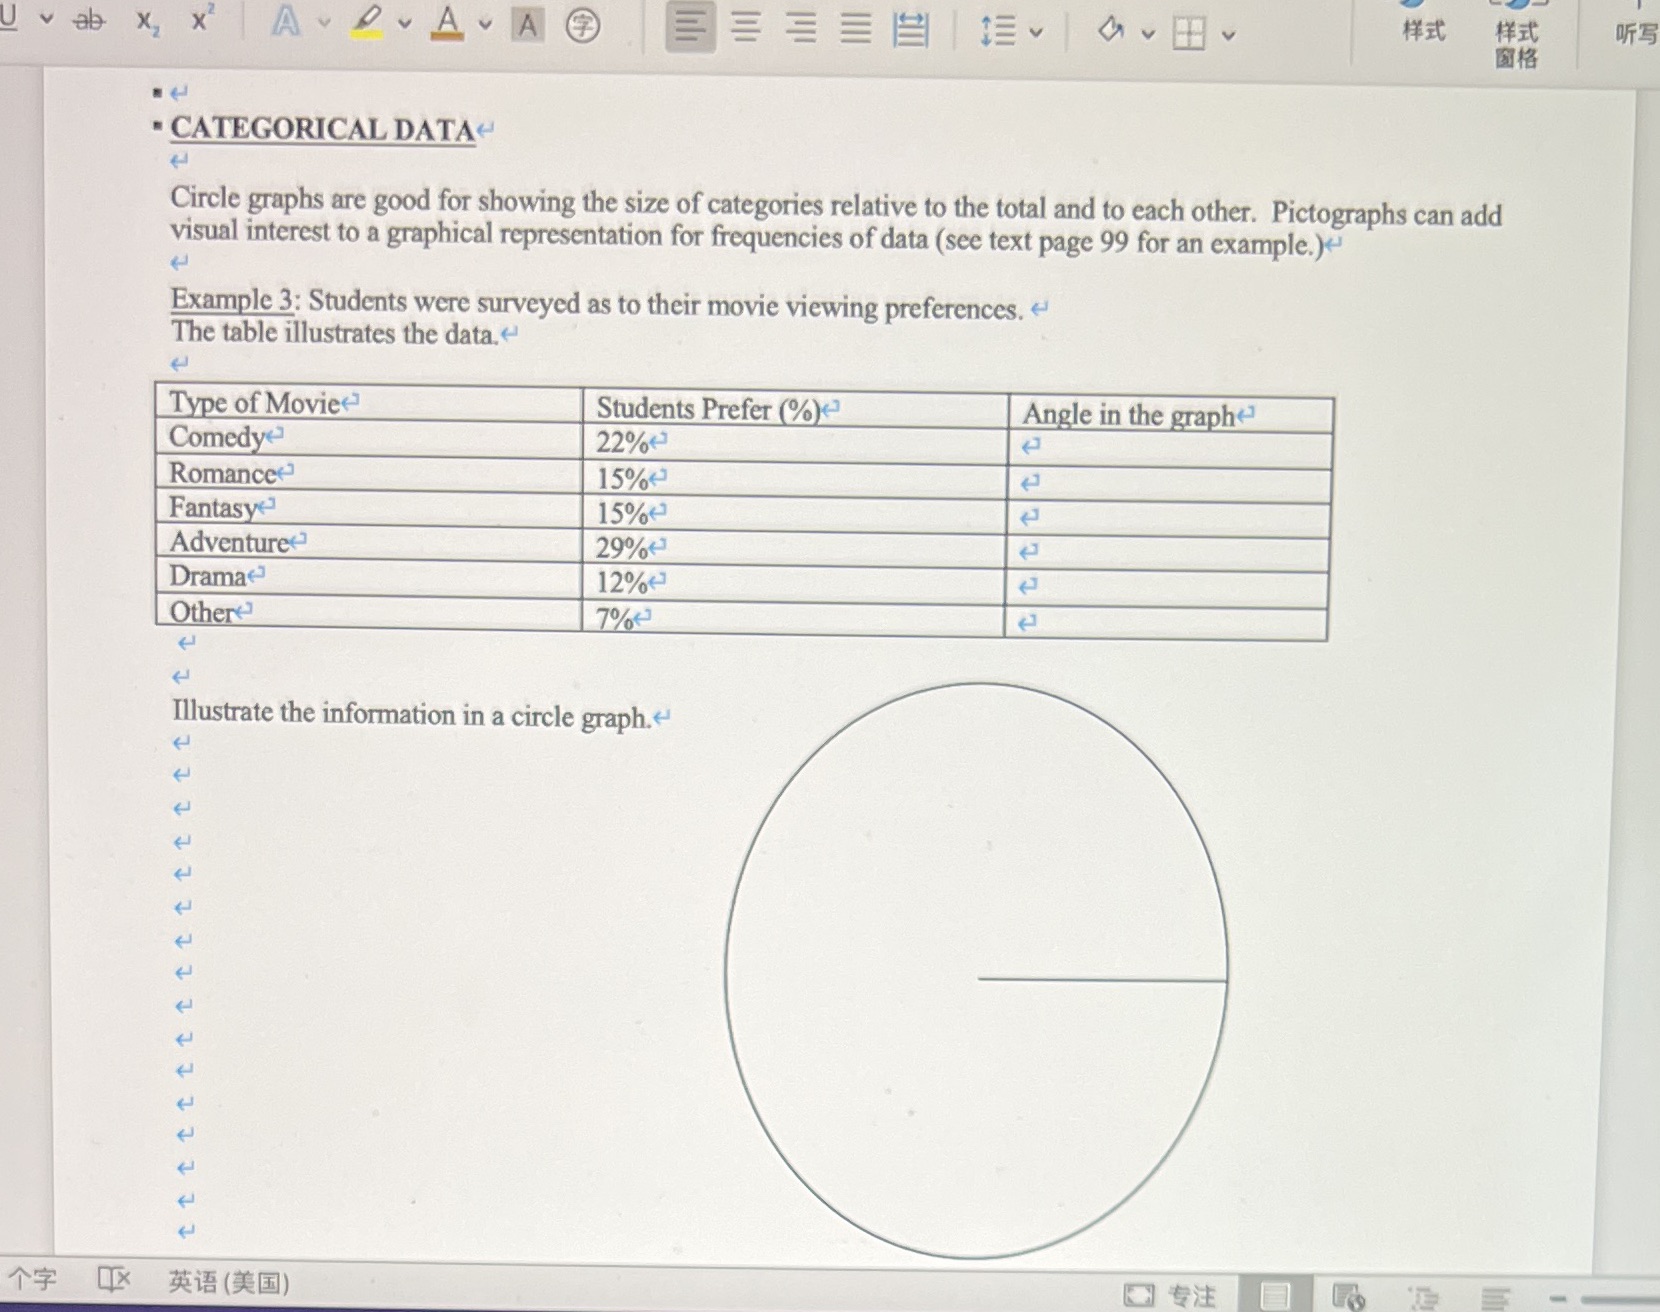
Uvab x x A LA AO E= = = F EV OF . CATEGORICAL DATA Circle graphs are good for showing the size of categories relative to the total and to each other. Pictographs can add visual interest to a graphical representation for frequencies of data (see text page 99 for an example.) Example 3: Students were surveyed as to their movie viewing preferences. ~ The table illustrates the data.~ Type of Movies Students Prefer (%) Angle in the graph Comedy 22% Romance 15%% Fantasy 15% Adventure 29% Drama 12% Other 7% Illustrate the information in a circle graph.~
Step by Step Solution
There are 3 Steps involved in it
1 Expert Approved Answer
Step: 1 Unlock

Question Has Been Solved by an Expert!
Get step-by-step solutions from verified subject matter experts
Step: 2 Unlock
Step: 3 Unlock