

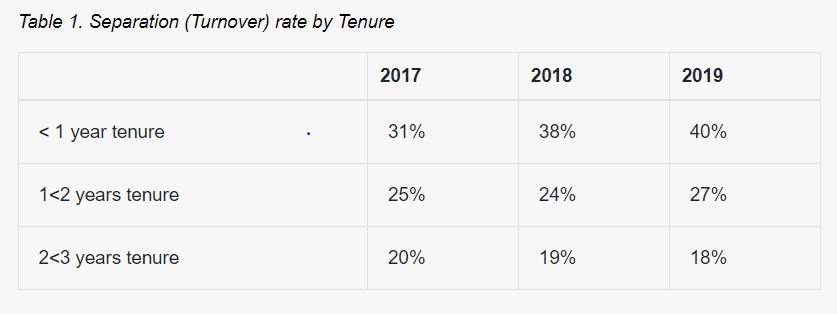
Question: Question: Based on the information below, draw a graph that displays the trend of retention rate by the tenure of hires in 2017. Compare the
Question: Based on the information below, draw a graph that displays the trend of retention rate by the tenure of hires in 2017. Compare the retention rates by Tenure over time and translate the results into managerial insights.
Step by Step Solution
There are 3 Steps involved in it
1 Expert Approved Answer
Step: 1 Unlock

Question Has Been Solved by an Expert!
Get step-by-step solutions from verified subject matter experts
Step: 2 Unlock
Step: 3 Unlock