

Question: question below Using information from the first graph below, we can tell that the firm's total cost curve is best represented by curve _ in
question below

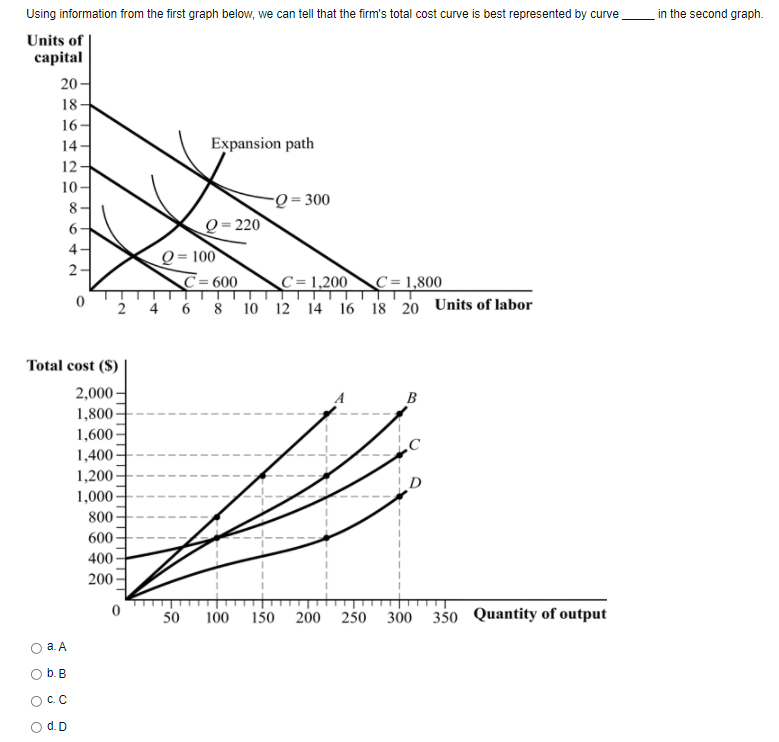
Using information from the first graph below, we can tell that the firm's total cost curve is best represented by curve _ in the second graph. Units of capital 20 - 18 - 16- 14- Expansion path 12- 10 8 - Q = 300 O = 220 O = 100 N C = 600 C= 1,200 C = 1,800 6 8 10 12 14 16 18 20 Units of labor Total cost ($) 2,000- 1,800- 1,600- 1,400 - 1,200- 1,000- 800- 600- 400- 200 0 50 100 150 200 250 300 350 Quantity of output O a.A Ob. B OCC O d. D
Step by Step Solution
There are 3 Steps involved in it
1 Expert Approved Answer
Step: 1 Unlock

Question Has Been Solved by an Expert!
Get step-by-step solutions from verified subject matter experts
Step: 2 Unlock
Step: 3 Unlock