

Question: Question: Buckeye Computer, Inc. produces high performance image generators for simulation (including PC-based visual system products) and visual workstations for high-end graphics applications. Its financial
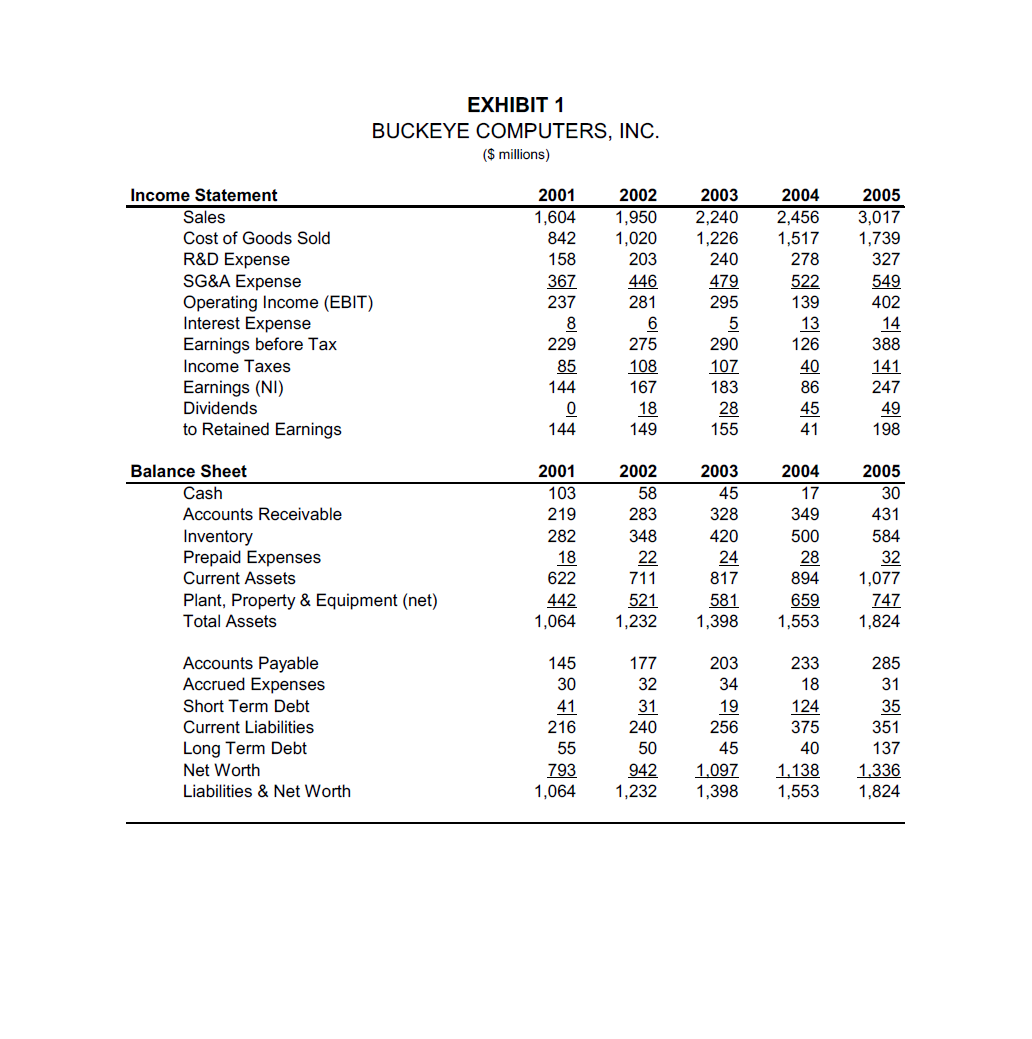
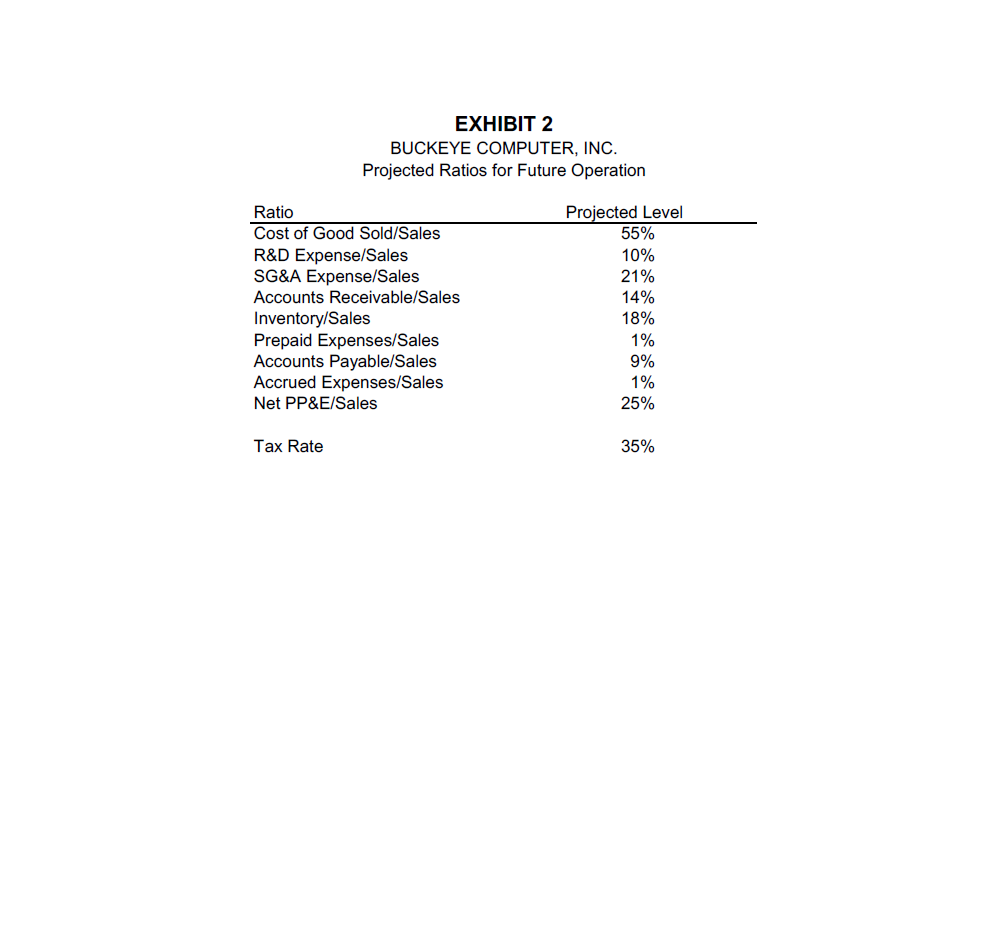
Question: Buckeye Computer, Inc. produces high performance image generators for simulation (including PC-based visual system products) and visual workstations for high-end graphics applications. Its financial statements are shown in Exhibit 1 (excel filed posted on Canvas). You forecast that Buckeye's revenue will grow each year by 15%. Estimate the free cash flows each year for the next five years 2006-2010. Use the following information to make your projections: Use the forecasting ratios provided in Exhibit 2 to project all other items (i.e. apart from sales). Note that all ratios are measured directly relative to sales1 (e.g. Inventory/Sales). Assume a tax rate of 35%.
Step by Step Solution
There are 3 Steps involved in it

Get step-by-step solutions from verified subject matter experts