

Question: Question-- (Chegg Homework Expert) Using the data from the spreadsheet, answer the following questions in a separate document. Set all your data for all sources
Question-- (Chegg Homework Expert)
Using the data from the spreadsheet, answer the following questions in a separate document.
Set all your data for all sources in the Interview strategy by Recruitment Source to zero. Next, increase the number of interviews from Part II for the recruitment source with the highest historical yield ratio until the FORECASTED number of hires in the FORECASTED column (e.g. cell F58) equals the ACTUAL number of hires (D58).
Question 2: What was your strategy for this scenario? Explain. (i.e., This will require you to change the numbers across all recruitment sources, to identify an optimal mix of recruitment sources. Next imagine that because of budget cutbacks, Salesteq will only budget $6,500 for the next years recruitment budget. Explain your strategy for this scenario.
As with the previous analysis, reset your interview numbers to the original data.
Assignment Purpose
Attracting employees by using different recruitment sources is an important aspect of human resource management. Analyzing the effects of different recruitment sources as well as the total strategy can assist in planning future recruitment strategies. In this assignment, you will analyze recruitment planning scenarios based on the recruitment experience of the Salesteq Corporation.
File Needed: HRM Analysis Assignment 2.xlsx Familiarize yourself with the spreadsheet before beginning your work.
Background
Salesteq Corporation is a successful consumer products company located in San Francisco. The company has been growing at a constant rate during the past three years. Productivity gains have been realized through computerization of its services. Salesteq has strongly supported its personnel staff since people are viewed as a critical asset for the continued success of the company.
Employees are recruited from four sources: the web, newspapers, radio, and referrals. All recruits are interviewed and a selection decision is made by someone based on the interview score? Salesteqs HR staff monitor the number of interviews they conduct by recruitment source. Additionally, recruitment data on the number of people hired, average performance of hires at the end of the first year, and total recruitment costs are collected.
In this assignment, you will be calculating a number of HR metrics pertaining to different areas of recruitment. These include metrics for assessing Salesteqs previous recruitment strategy, planned interview strategy, and actual vs. forecasted recruitment. These computations will help you to understand what assessments go into evaluating different areas of recruitment at an organization.
Note As you work through the assignment, please be sure to continually save your work after each section. Save your work as a new Excel file using your first initial and last name. For example, Nicolra Nnamdi would be:
NNnamdi_HRMAnalysis2.xlsx.
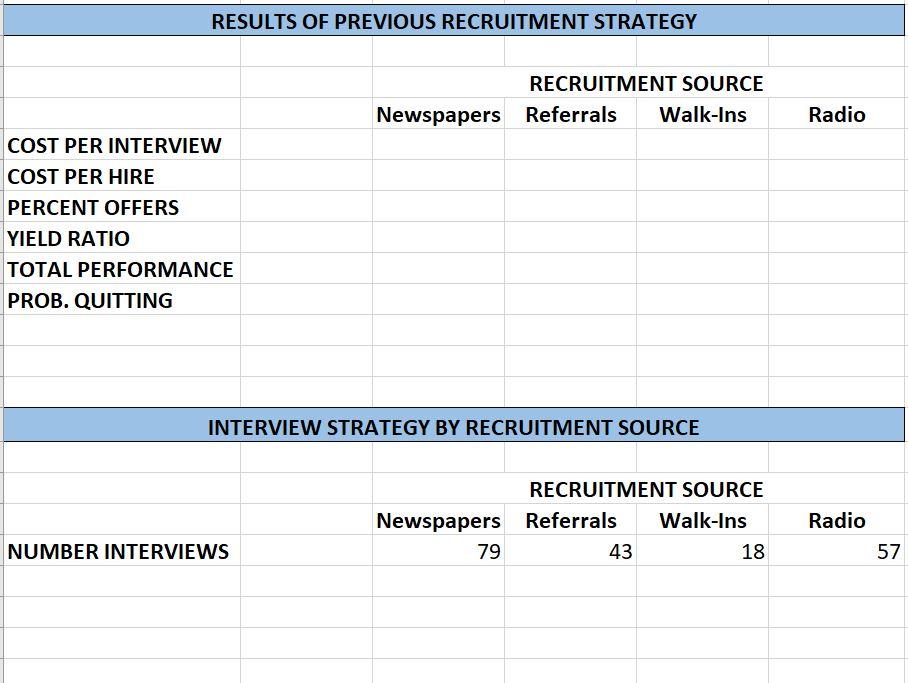
Part I Results of Previous Recruitment Strategy
Please refer to the data in the section of the Excel sheet titled Recruitment Data by Source for Previous Year to complete the calculations below. In this section, you will be looking backwards at your interview strategy and success by calculating a number of key metrics. These are:
1. Cost Per Interview. Calculate cost per interview by dividing the total cost for recruiting for each source by the number of interviews. Calculate this for all sources.
2. Cost Per Hire. Calculate cost per hire by dividing the total cost for recruiting by source by the number of hires. Calculate this for all sources.
3. Percent Offers. Calculate percent offers by dividing the number of offers extended to candidates for each source by the number of interviews. Calculate this for all sources.
4. Yield Ratio. Calculate yield ratio by dividing the number of hires from each source by the number of interviews for each source. Calculate this for all sources.
5. Total Performance. Calculate total performance by source by multiplying the number of hires by source by the average performance. Calculate this for all sources.
6. Probability of Quitting. Calculate an estimate the quitting probability for hires of each source by dividing the number of quits in year 1 (e.g. the anticipated number of new hires who will quit within the first year) by the number of hires. Calculate this for all sources.
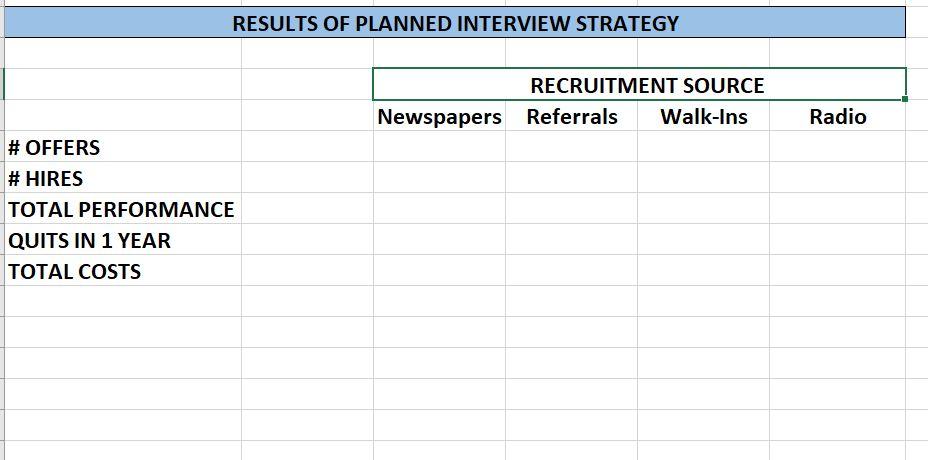
Part II Results of Planned Interview Strategy
Please refer to the data in the sections of the Excel sheet titled Interview Strategy by Recruitment Source and Results of Planned Interview Strategy to complete the calculations below. In this section, you will be forecasting your recruitment plans for the coming year.
1. Number of Offers. To obtain the number offers, multiply the number of interviews by the percent offers received last year. Do this for each recruitment source.
2. Number of Hires. To obtain this figure, multiply the number of interviews for newspapers by the yield ratio from last year. Do this for each recruitment source.
3. Total Performance. To obtain this figure, multiply the number of hires by the average performance from last year (Row 12). Do this for each recruitment source.
4. Quits in 1 Year. To estimate the quits in one year, multiply the number of hires by the probability quitting last year. Do this for each source.
5. Total Cost. To obtain the total cost of recruiting by newspaper, multiply the number of interviews for newspapers by the cost per interview for newspapers. Do this for each recruitment source.
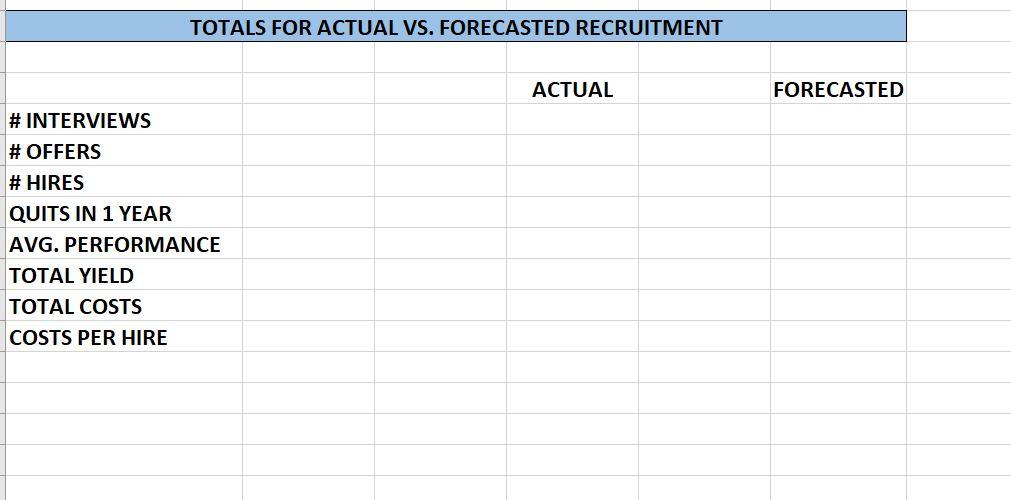
Part III Totals for Actual vs. Forecasted Recruitment
Please refer to the data in the section of the Excel sheet titled Totals for Actual vs. Forecasted Recruitment to complete the calculations below. Notice that this section of the spreadsheet presents a summary analysis so the effects of forecasted recruitment scenarios can be quickly compared with previous data. Notice also that the ACTUAL and FORECASTED columns are already completed. The ACTUAL column represents actual data from last year. The FORECASTED column represents our forecasted information from above.
The ACTUAL and FORECASTED columns currently yield identical results because the # Interview figures found on the Recruitment Data by Source for Previous Year section and the Interview Strategy by Recruitment Source data are the same. This was done to ensure that you entered your formulas correctly.
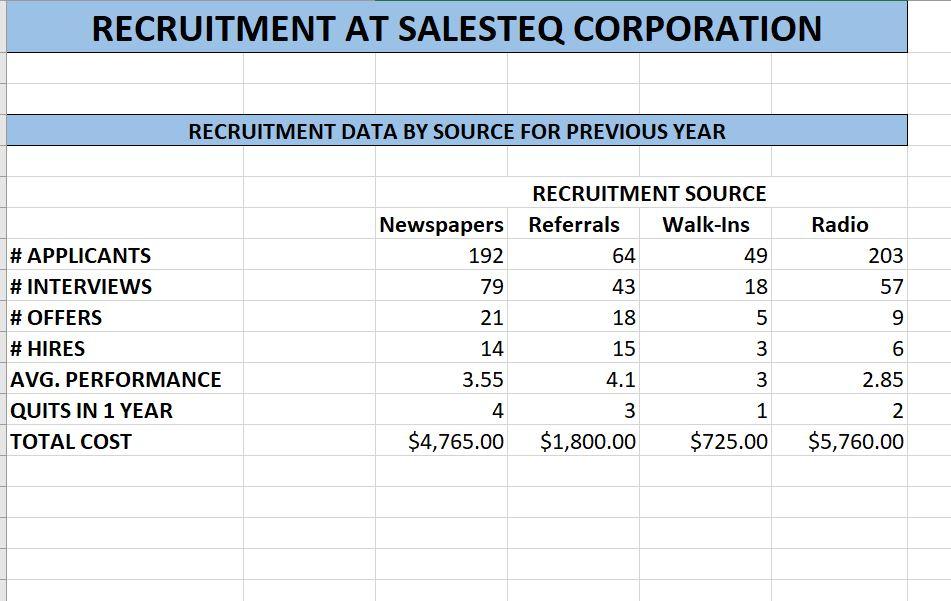
RECRUITMENT AT SALESTEQ CORPORATION RECRUITMENT DATA BY SOURCE FOR PREVIOUS YEAR RECRUITMENT SOURCE \begin{tabular}{|l|r|r|r|r|} & Newspapers & Referrals & Walk-Ins & \multicolumn{1}{c|}{ Radio } \\ \hline \# APPLICANTS & 192 & 64 & 49 & 203 \\ \hline \# INTERVIEWS & 79 & 43 & 18 & 57 \\ \hline \# OFFERS & 21 & 18 & 5 & 9 \\ \hline \# HIRES & 14 & 15 & 3 & 6 \\ \hline AVG. PERFORMANCE & 3.55 & 4.1 & 3 & 2.85 \\ \hline QUITS IN 1 YEAR & 4 & 3 & 1 & 2 \\ \hline TOTAL COST & $4,765.00 & $1,800.00 & $725.00 & $5,760.00 \\ \hline \end{tabular} RESULTS OF PREVIOUS RECRUITMENT STRATEGY RECRUITMENT SOURCE Newspapers Referrals Walk-Ins Radio COST PER INTERVIEW COST PER HIRE PERCENT OFFERS YIELD RATIO TOTAL PERFORMANCE PROB. QUITTING INTERVIEW STRATEGY BY RECRUITMENT SOURCE RECRUITMENT SOURCE NUMBER INTERVIEWS RESULTS OF PLANNED INTERVIEW STRATEGY RECRUITMENT SOURCE \# OFFERS Newspapers Referrals Walk-Ins Radio \# HIRES TOTAL PERFORMANCE QUITS IN 1 YEAR TOTAL COSTS TOTALS FOR ACTUAL VS. FORECASTED RECRUITMENT ACTUAL FORECASTED \# INTERVIEWS \# OFFERS \# HIRES QUITS IN 1 YEAR AVG. PERFORMANCE TOTAL YIELD TOTAL COSTS COSTS PER HIRE
Step by Step Solution
There are 3 Steps involved in it

Get step-by-step solutions from verified subject matter experts