

Question: Question completion Consider the diagram below. Fill in the blanke with the proper labels Yellow Area Potential GDP 2 GDP Blue Area 1 Time 6
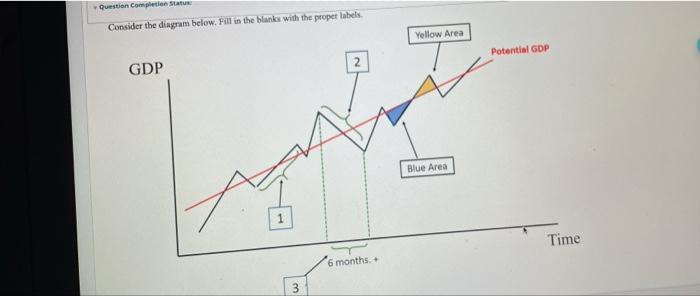
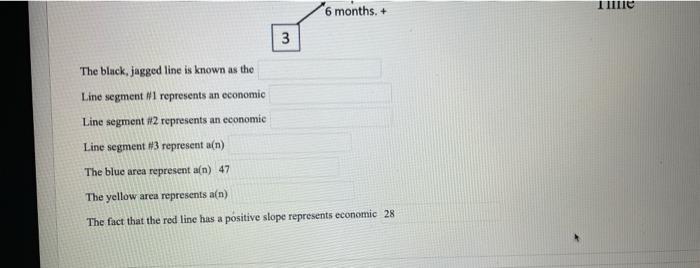
Question completion Consider the diagram below. Fill in the blanke with the proper labels Yellow Area Potential GDP 2 GDP Blue Area 1 Time 6 months. + Ile 6 months. + 3 The black, jagged line is known as the Line segment #1 represents an economic Line segment #2 represents an economic Line segment #3 represent a(n) The blue area represent a[n) 47 The yellow area represents an) The fact that the red line has a positive slope represents economic 28
Step by Step Solution
There are 3 Steps involved in it
1 Expert Approved Answer
Step: 1 Unlock

Question Has Been Solved by an Expert!
Get step-by-step solutions from verified subject matter experts
Step: 2 Unlock
Step: 3 Unlock