Question: Question Completion Sta Spits Question 2 Given the data in the following figure, how would you compare the efficiency of the garments firms namely Gup,
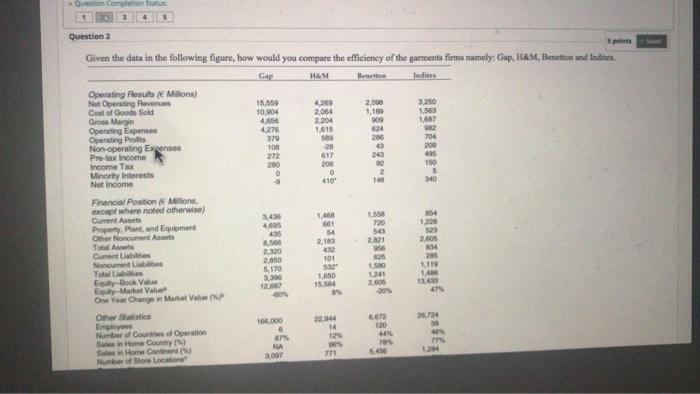
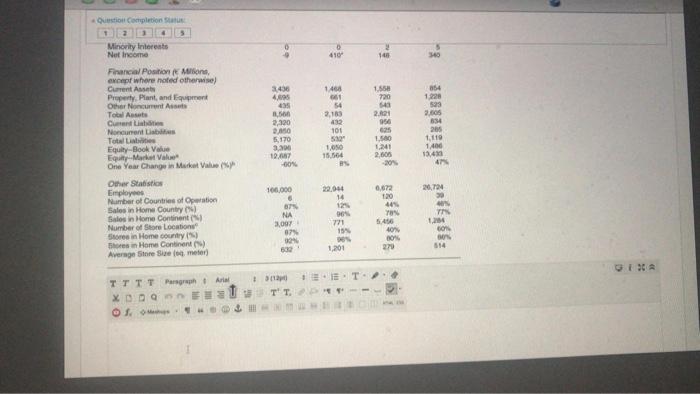
Question Completion Sta Spits Question 2 Given the data in the following figure, how would you compare the efficiency of the garments firms namely Gup, H&M, Benetton and Indites HAM 4,200 2,064 2204 1615 560 2.00 1180 300 15.550 10,904 4,656 4.270 370 100 272 200 0 3.250 1.56 16 704 200 405 150 5 340 200 0 410 054 3.49 1. 1462 Operating results 1 Millions) Net Operating Revenues Cost of Good Sold Gross Margin Operating Expenses Operating profits Non-operating Expenses Pretax income Income Tax Minority Interests Not Income Financial Position Millions of where noted otherwise) Current A Property. Plant, and Equipment Other Nonduan Asas Tool A Current Noncord Total EBook Value E-Market Value One Year Change Mare Value Other Statistics Employees Number of Countries of Operation SaleHow County) Sein Home Continen Number of one o 495 2.183 2.21 3.30 22.50 5.170 523 2.00 04 285 1110 101 1650 155 1.50 1201 2008 20% 4 son . 100.000 14 NA BUT . Question completion 0 410 14 340 1468 3436 4 45 1.55 720 sa 54 2.183 654 1.22 52 84 2.05 954 100 1.500 Minority interest Net Income Financial Position in except where noted otherwise Current Ansel Property. Plant, and Equipo Other Noncurrent A Tout Cuanda Noncurrentibes Total Egy-Book Value E-Market value One Year Change in Mat Value Other Statistics Employees Number of Countries of Operation Sales in Home Country) Sale in Home Continent Number of Store Location Stores in Home country's Stores in Home Continent Average Store meter) 2,320 2.00 5.170 300 19.07 -60% 1.NO 15.564 1.110 1400 13.4 -20% 100.000 0.672 2004 50 45 NA YEN IN 2007 71 154 40 00% 20 514 1,201 TTTT Page Arte XODE TT. Question Completion Sta Spits Question 2 Given the data in the following figure, how would you compare the efficiency of the garments firms namely Gup, H&M, Benetton and Indites HAM 4,200 2,064 2204 1615 560 2.00 1180 300 15.550 10,904 4,656 4.270 370 100 272 200 0 3.250 1.56 16 704 200 405 150 5 340 200 0 410 054 3.49 1. 1462 Operating results 1 Millions) Net Operating Revenues Cost of Good Sold Gross Margin Operating Expenses Operating profits Non-operating Expenses Pretax income Income Tax Minority Interests Not Income Financial Position Millions of where noted otherwise) Current A Property. Plant, and Equipment Other Nonduan Asas Tool A Current Noncord Total EBook Value E-Market Value One Year Change Mare Value Other Statistics Employees Number of Countries of Operation SaleHow County) Sein Home Continen Number of one o 495 2.183 2.21 3.30 22.50 5.170 523 2.00 04 285 1110 101 1650 155 1.50 1201 2008 20% 4 son . 100.000 14 NA BUT . Question completion 0 410 14 340 1468 3436 4 45 1.55 720 sa 54 2.183 654 1.22 52 84 2.05 954 100 1.500 Minority interest Net Income Financial Position in except where noted otherwise Current Ansel Property. Plant, and Equipo Other Noncurrent A Tout Cuanda Noncurrentibes Total Egy-Book Value E-Market value One Year Change in Mat Value Other Statistics Employees Number of Countries of Operation Sales in Home Country) Sale in Home Continent Number of Store Location Stores in Home country's Stores in Home Continent Average Store meter) 2,320 2.00 5.170 300 19.07 -60% 1.NO 15.564 1.110 1400 13.4 -20% 100.000 0.672 2004 50 45 NA YEN IN 2007 71 154 40 00% 20 514 1,201 TTTT Page Arte XODE TT