

Question: Question Completion Status: 1 2 3 4 10 11 145 155 165 18 QUESTION 11 Exhibit 4: The following are the ANOVA results from a
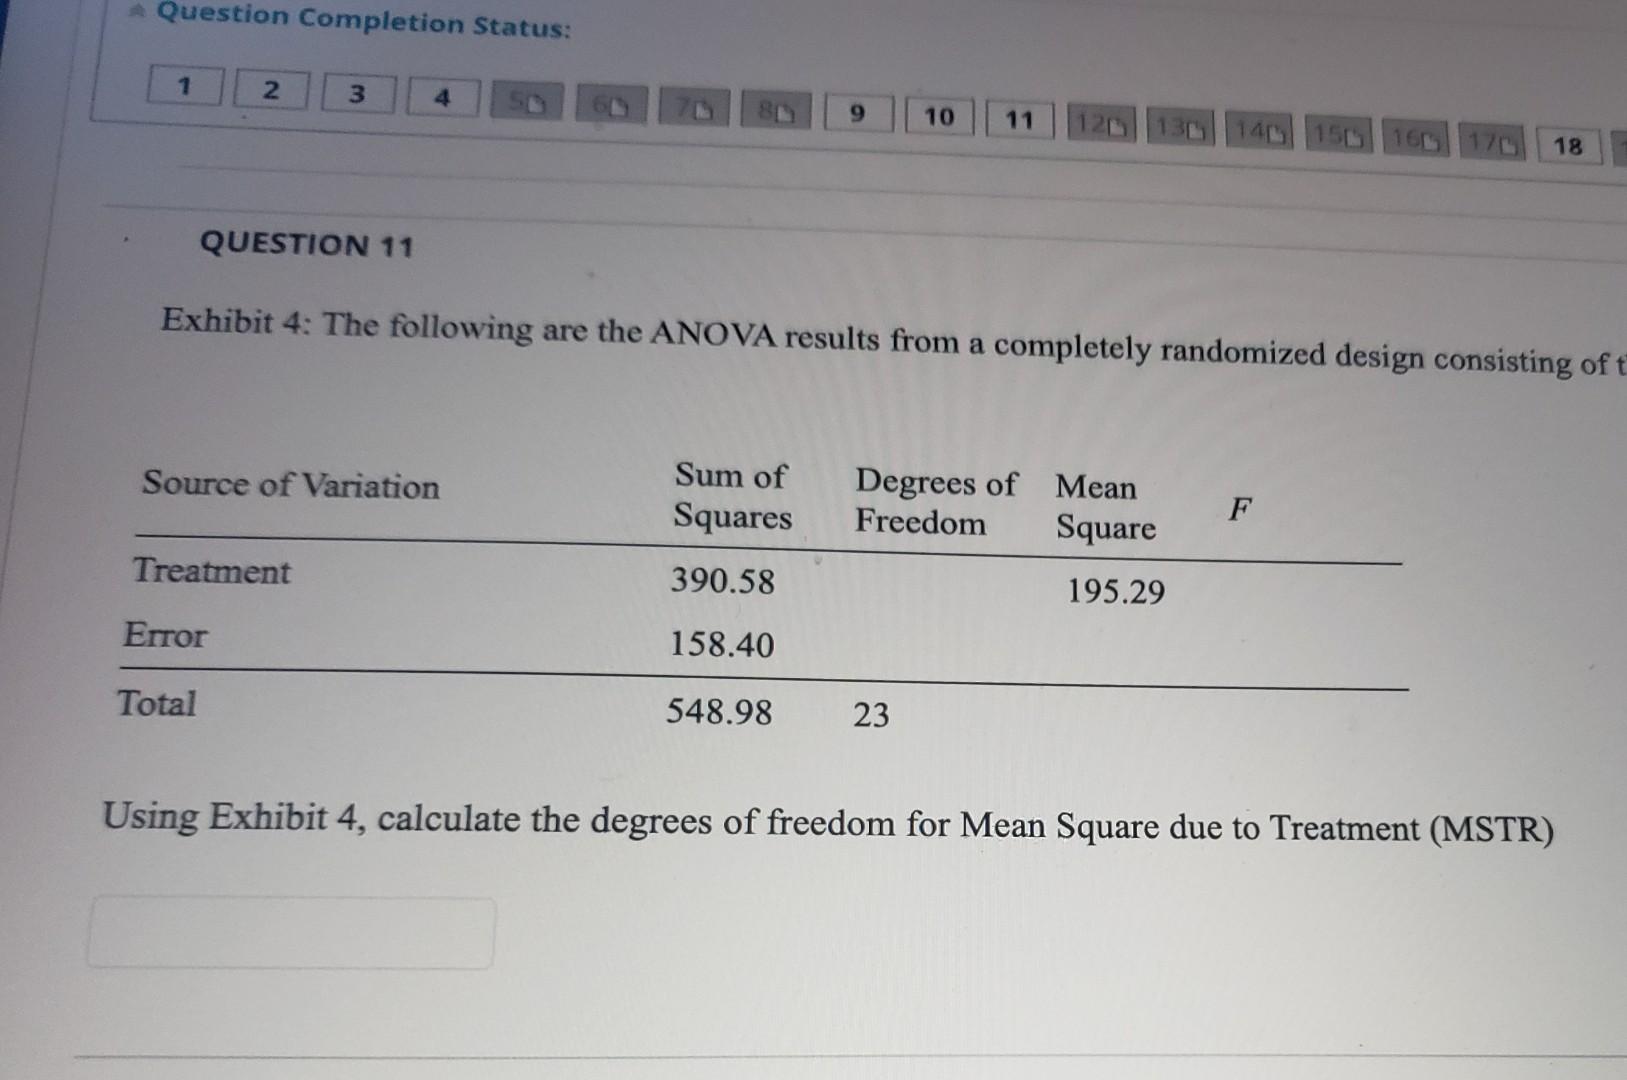
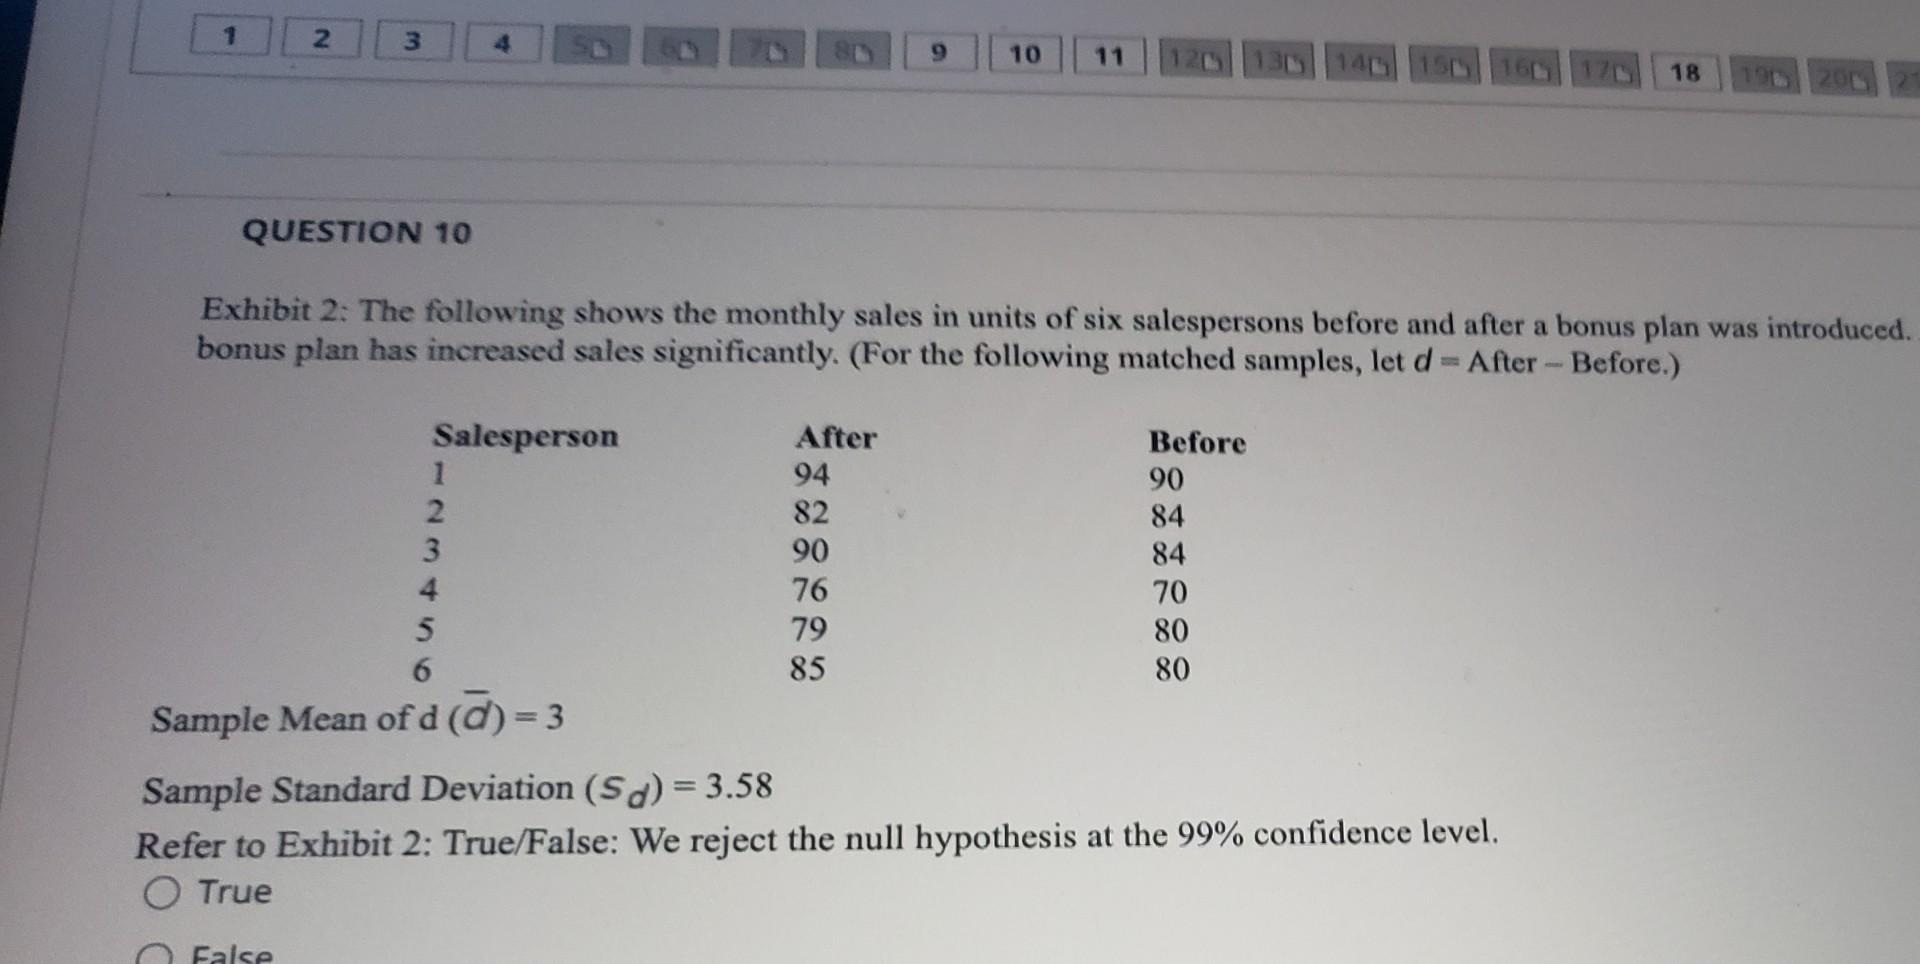
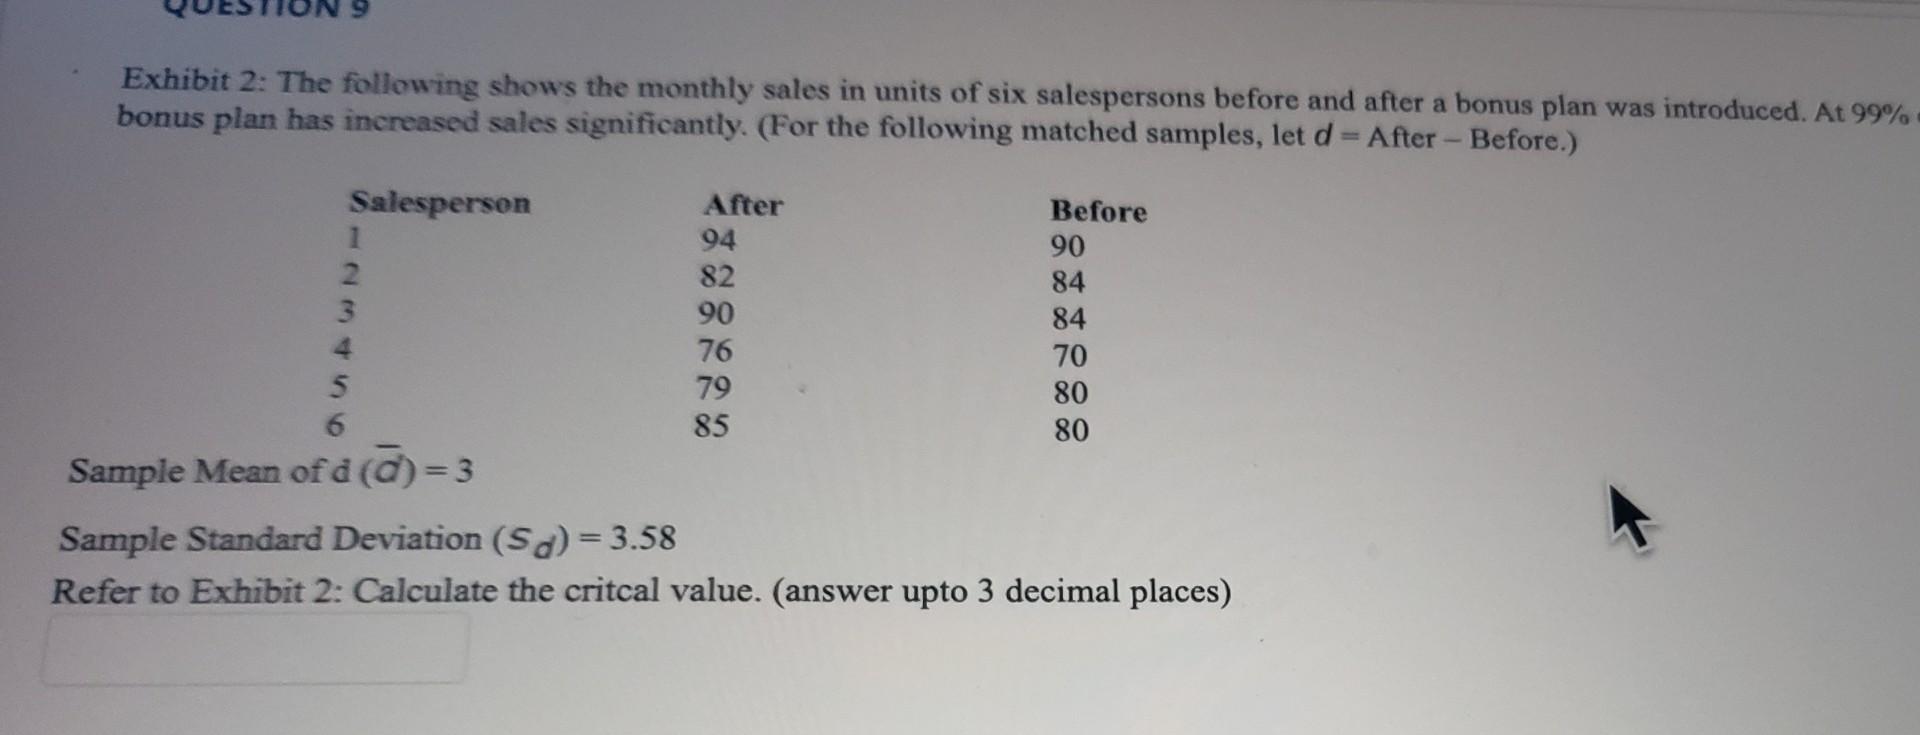
Question Completion Status: 1 2 3 4 10 11 145 155 165 18 QUESTION 11 Exhibit 4: The following are the ANOVA results from a completely randomized design consisting of t Source of Variation Sum of Squares Degrees of Mean Freedom Square F Treatment 390.58 195.29 Error 158.40 Total 548.98 23 Using Exhibit 4, calculate the degrees of freedom for Mean Square due to Treatment (MSTR) 1 2 3 4 9 10 11 18 QUESTION 10 Exhibit 2: The following shows the monthly sales in units of six salespersons before and after a bonus plan was introduced. bonus plan has increased sales significantly. (For the following matched samples, let d= After - Before.) Salesperson After Before 1 94 90 2 82 84 3 90 84 4 76 70 5 79 80 6 85 80 Sample Mean of d(7)=3 Sample Standard Deviation (Sd) = 3.58 Refer to Exhibit 2: True/False: We reject the null hypothesis at the 99% confidence level. O True False Exhibit 2: The following shows the monthly sales in units of six salespersons before and after a bonus plan was introduced. At 99% bonus plan has increased sales significantly. (For the following matched samples, let d = After - Before.) Salesperson After Before 1 94 90 2 82 84 3 90 84 76 70 5 79 80 6 85 80 Sample Mean of d ()=3 Sample Standard Deviation (Sd) = 3.58 Refer to Exhibit 2: Calculate the critcal value. (answer upto 3 decimal places)
Step by Step Solution
There are 3 Steps involved in it
1 Expert Approved Answer
Step: 1 Unlock

Question Has Been Solved by an Expert!
Get step-by-step solutions from verified subject matter experts
Step: 2 Unlock
Step: 3 Unlock