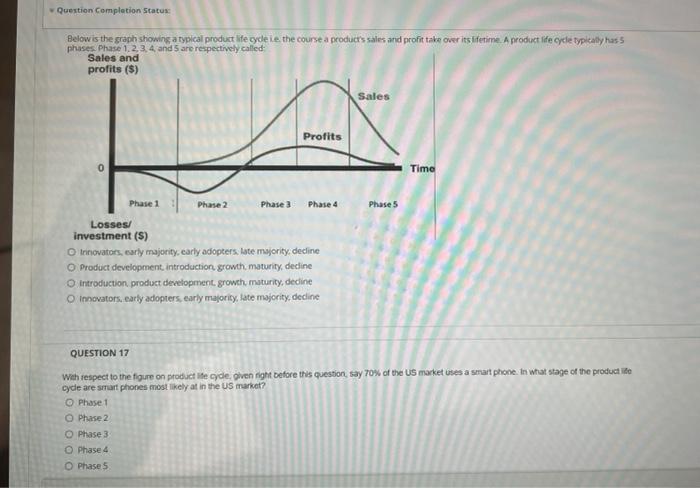
Question: Question Completion Status: Below is the graph showing a typical product life cycle te the course a products sales and profit take over its lifetime.

Question Completion Status: Below is the graph
Question Completion Status: Below is the graph showing a typical product life cycle te the course a products sales and profit take over its lifetime. A product life cycle typically hass phasesand are respectively called profits ($) Sales and Sales Profits Time Phases Phase 1 Phase 2 Phase 3 Phase 4 Losses/ investment (S) Innovators, early majority, early adopters, late majority, decline O Product development, introduction, growth. maturity, decline Introduction product development, growth maturity, decline Innovators, early adopters early majority, late majority, decline QUESTION 17 With respect to the figure on product teyde, give right before this question, say 70% of the US market uses a smart phone in what stage of the productie cycle are smartphones most likely at in the US market? Phase 1 Phase 2 O Phase 3 Phase 4 O Phase 5

Step by Step Solution

There are 3 Steps involved in it

1 Expert Approved Answer
Step: 1 Unlock blur-text-image
Question Has Been Solved by an Expert!

Get step-by-step solutions from verified subject matter experts

Step: 2 Unlock
Step: 3 Unlock

Students Have Also Explored These Related General Management Questions!