

Question: Question Completion Status: Click Here For More QUESTION 17 18 points Save Answer The table in Distance traveled by vehicles.xIsx shows the average quarterly distance
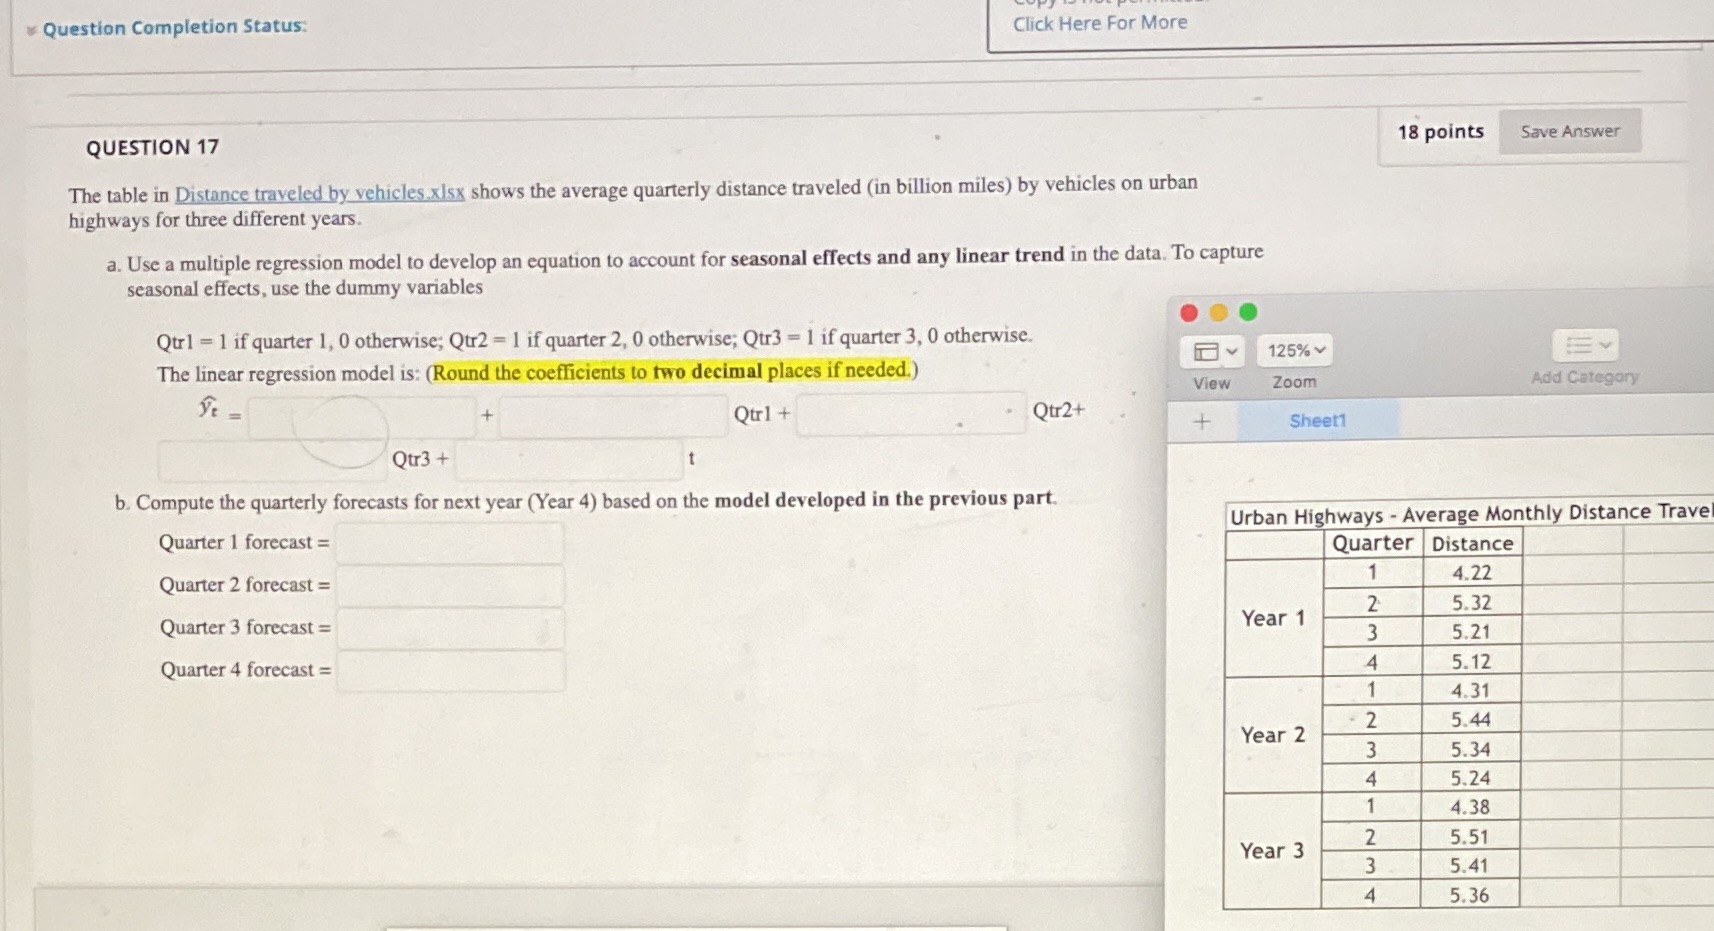
Question Completion Status: Click Here For More QUESTION 17 18 points Save Answer The table in Distance traveled by vehicles.xIsx shows the average quarterly distance traveled (in billion miles) by vehicles on urban highways for three different years. a. Use a multiple regression model to develop an equation to account for seasonal effects and any linear trend in the data. To capture seasonal effects, use the dummy variables ... Qtr1 = 1 if quarter 1, 0 otherwise; Qtr2 = 1 if quarter 2, 0 otherwise; Qur3 = 1 if quarter 3, 0 otherwise. 125% Ev The linear regression model is: (Round the coefficients to two decimal places if needed.) View Zoom Add Category It = Qtr1 + Qtr 2+ + Sheet1 Qtr3 + b. Compute the quarterly forecasts for next year (Year 4) based on the model developed in the previous part. Urban Highways - Average Monthly Distance Trave Quarter 1 forecast = Quarter Distance Quarter 2 forecast = 1 4.22 2 5.32 Quarter 3 forecast = Year 1 3 5.21 Quarter 4 forecast = 4 5.12 1 4.31 Year 2 - 2 5.44 3 5.34 4 5.24 1 4.38 Year 3 5.51 3 5.41 4 5.36
Step by Step Solution
There are 3 Steps involved in it

Get step-by-step solutions from verified subject matter experts