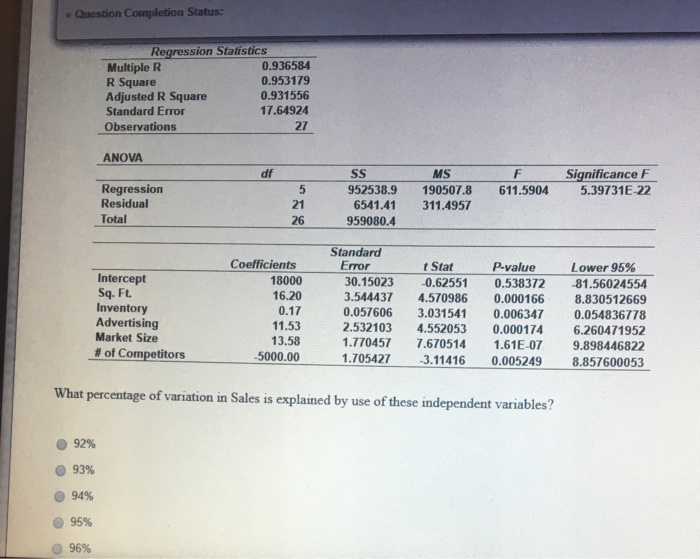
Question: Question Completion Status: Regression Statistics Multiple R 0.936584 R Square 0.953179 Adjusted R Square 0.931556 Standard Error 17.64924 Observations 27 ANOVA F SS 952538.9 6541.41

Question Completion Status: Regression Statistics
Question Completion Status: Regression Statistics Multiple R 0.936584 R Square 0.953179 Adjusted R Square 0.931556 Standard Error 17.64924 Observations 27 ANOVA F SS 952538.9 6541.41 959080.4 MS 190507.8 311.4957 Significance F 5.39731E-22 Regression Residual Total 611.5904 21 26 Intercept Sq. Ft. Inventory Advertising Market Size # of Competitors Coefficients 18000 16.20 0.17 11.53 13.58 -5000.00 Standard Error 30.15023 3.544437 0.057606 2.532103 1.770457 1.705427 t Stat -0.62551 4.570986 3.031541 4.552053 7.670514 3.11416 P-value 0.538372 0.000166 0.006347 0.000174 1.61E-07 0.005249 Lower 95% 81.56024554 8.830512669 0.054836778 6.260471952 9.898446822 8.857600053 What percentage of variation in Sales is explained by use of these independent variables? 92% 93% 94% 95% 96%

Step by Step Solution

There are 3 Steps involved in it

1 Expert Approved Answer
Step: 1 Unlock blur-text-image
Question Has Been Solved by an Expert!

Get step-by-step solutions from verified subject matter experts

Step: 2 Unlock
Step: 3 Unlock

Students Have Also Explored These Related General Management Questions!