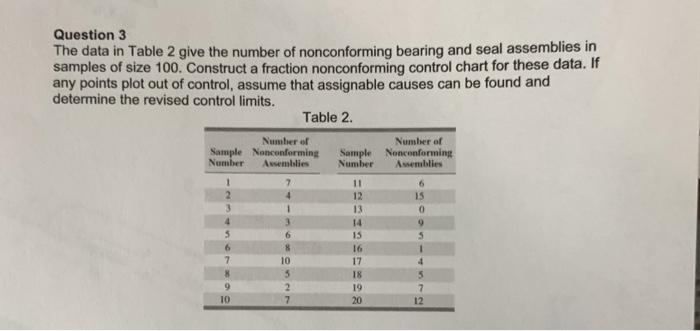
Question: Question 3 The data in Table 2 give the number of nonconforming bearing and seal assemblies in samples of size 100. Construct a fraction nonconforming

Question 3 The data in Table 2 give the number of
Question 3 The data in Table 2 give the number of nonconforming bearing and seal assemblies in samples of size 100. Construct a fraction nonconforming control chart for these data. If any points plot out of control, assume that assignable causes can be found and determine the revised control limits. Table 2. Number of Sample Nonconforming Number Asemblies Number of Sample Nonconforming Number Assemblies 1 7 2 1 6 $ 6 7 8 9 10 11 12 13 14 15 16 17 18 19 20 6 15 0 . 5 1 4 5 7 12 10 5 2 7

Step by Step Solution

There are 3 Steps involved in it

1 Expert Approved Answer
Step: 1 Unlock blur-text-image
Question Has Been Solved by an Expert!

Get step-by-step solutions from verified subject matter experts

Step: 2 Unlock
Step: 3 Unlock

Students Have Also Explored These Related General Management Questions!