

Question: Question content area Part 1 The following table shows the actual demand observed over the last 1 1 years: Year 1 2 3 4 5
Question content area
Part
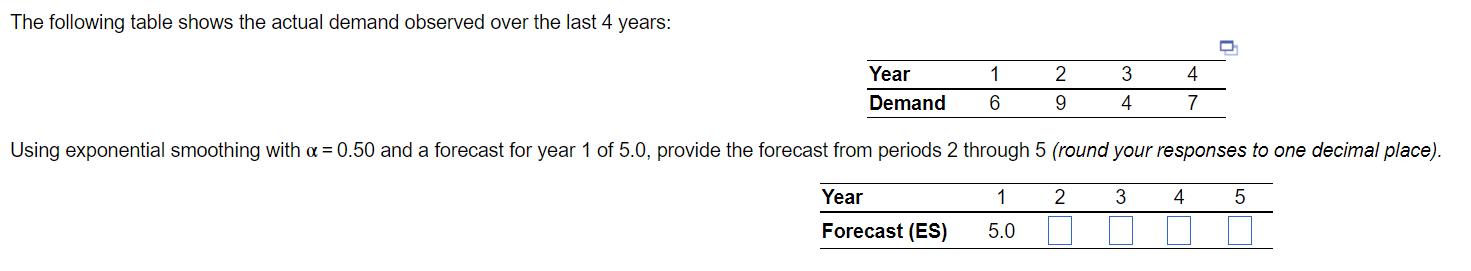
The following table shows the actual demand observed over the last years:
Year
Demand
Part
Using exponential smoothing with alpha and a forecast for year of provide the forecast from periods through The following table shows the actual demand observed over the last years:
Using exponential smoothing with and a forecast for year of provide the forecast from periods through round your responses to one decimal place
Step by Step Solution
There are 3 Steps involved in it
1 Expert Approved Answer
Step: 1 Unlock

Question Has Been Solved by an Expert!
Get step-by-step solutions from verified subject matter experts
Step: 2 Unlock
Step: 3 Unlock