

Question: Question content area top Part 1 A sample? mean, sample? size, and sample standard deviation are provided below. Use the? one-mean t-test to perform the
Question content area top
Part 1
A sample? mean, sample? size, and sample standard deviation are provided below. Use the? one-mean t-test to perform the required hypothesis test at the
1010?%
significance level.
x overbarxequals=2222?,
ssequals=66?,
nnequals=1515?,
Upper H 0H0?:
mu equals 21?=21?,
Upper H Subscript aHa?:
mu not equals 21??21
LOADING...
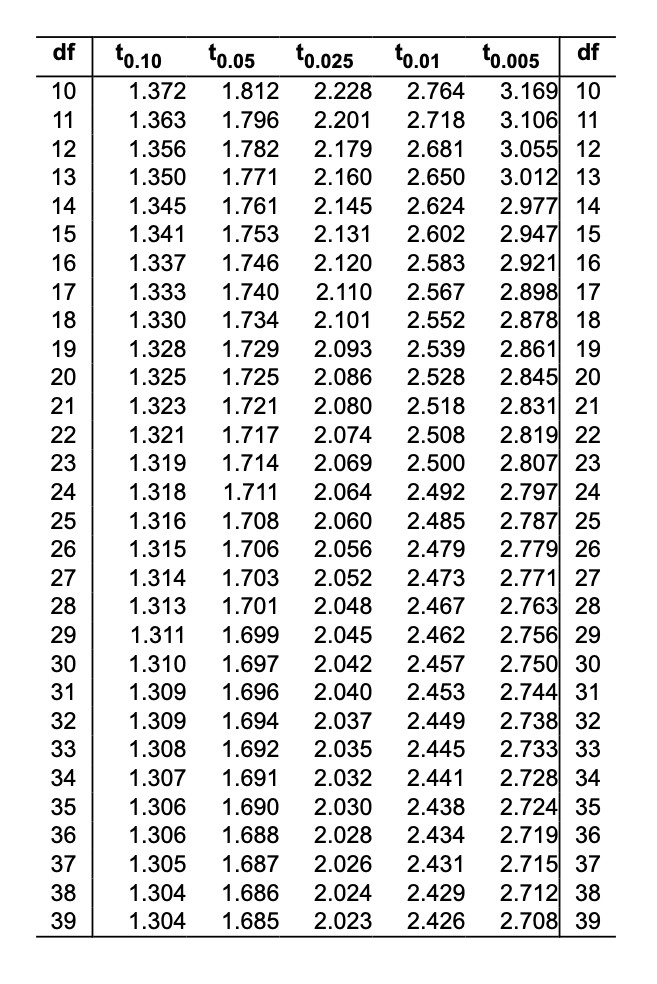
Click here to view a partial table of values of
t Subscript alphat?.
Question content area bottom
Part 1
The test statistic is
ttequals=enter your response here.
?(Round to two decimal places as? needed.)
Step by Step Solution
There are 3 Steps involved in it
1 Expert Approved Answer
Step: 1 Unlock

Question Has Been Solved by an Expert!
Get step-by-step solutions from verified subject matter experts
Step: 2 Unlock
Step: 3 Unlock