

Question: Question content area top Part 1 Complete the following steps for the given function, interval, and value o f n . a . Sketch the
Question content area top
Part
Complete the following steps for the given function, interval, and value
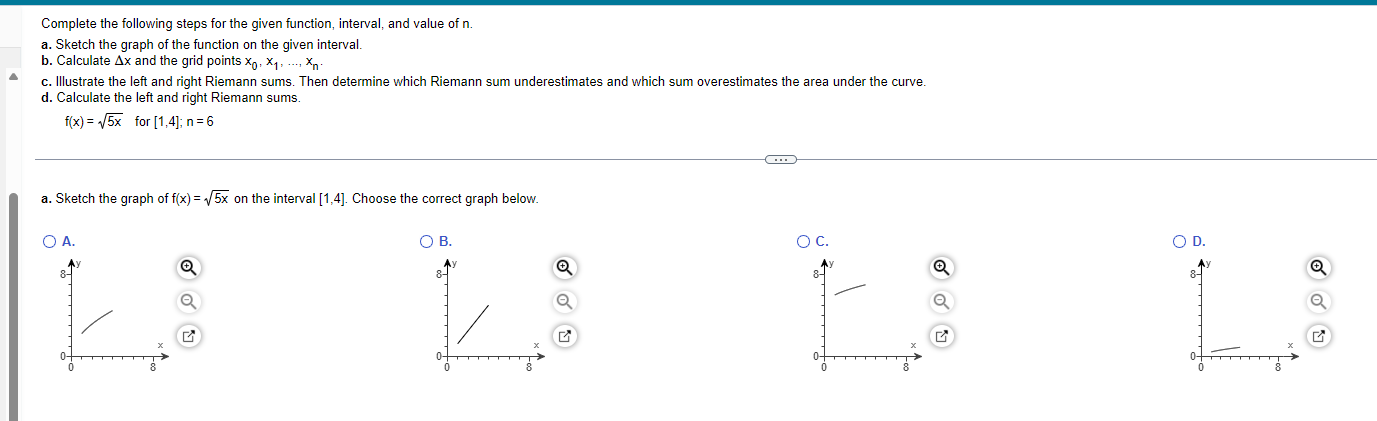
Sketch the graph the function the given interval.
Calculate
Upper Delta
and the grid points
Subscript
Illustrate the left and right Riemann sums. Then determine which Riemann sum underestimates and which sum overestimates the area under the curve.
Calculate the left and right Riemann sums.
for Complete the following steps for the given function, interval, and value
Sketch the graph the function the given interval.
Calculate and the grid points dots,
Illustrate the left and right Riemann sums. Then determine which Riemann sum underestimates and which sum overestimates the area under the curve.
Calculate the left and right Riemann sums.
for ;
Sketch the graph the interval Choose the correct graph below.;
Step by Step Solution
There are 3 Steps involved in it
1 Expert Approved Answer
Step: 1 Unlock

Question Has Been Solved by an Expert!
Get step-by-step solutions from verified subject matter experts
Step: 2 Unlock
Step: 3 Unlock