

Question: QUESTION: !!!!!!!!DATA: 3. Develop a range of values for Harley's stock based on the selected value metric. Support and defend your value range. Harley-Davidson Inc.
QUESTION:
!!!!!!!!DATA:
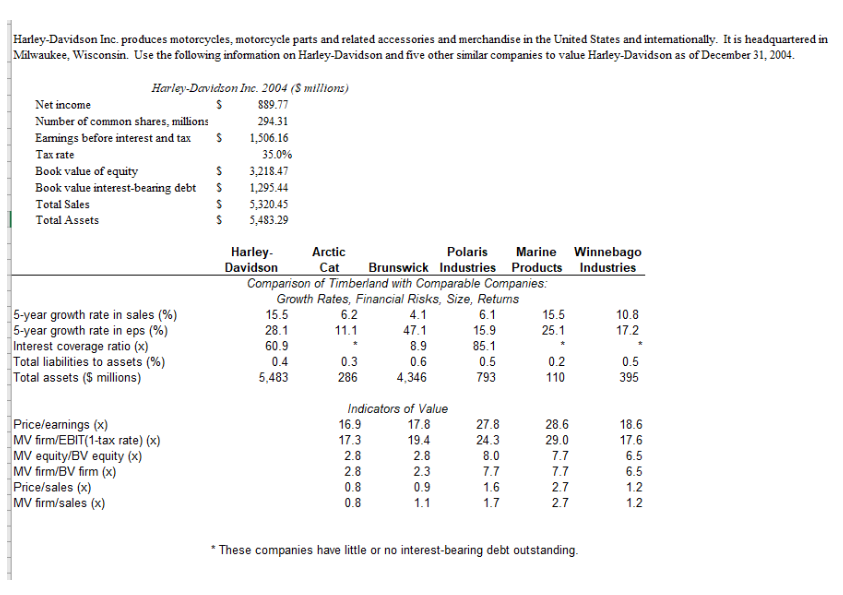
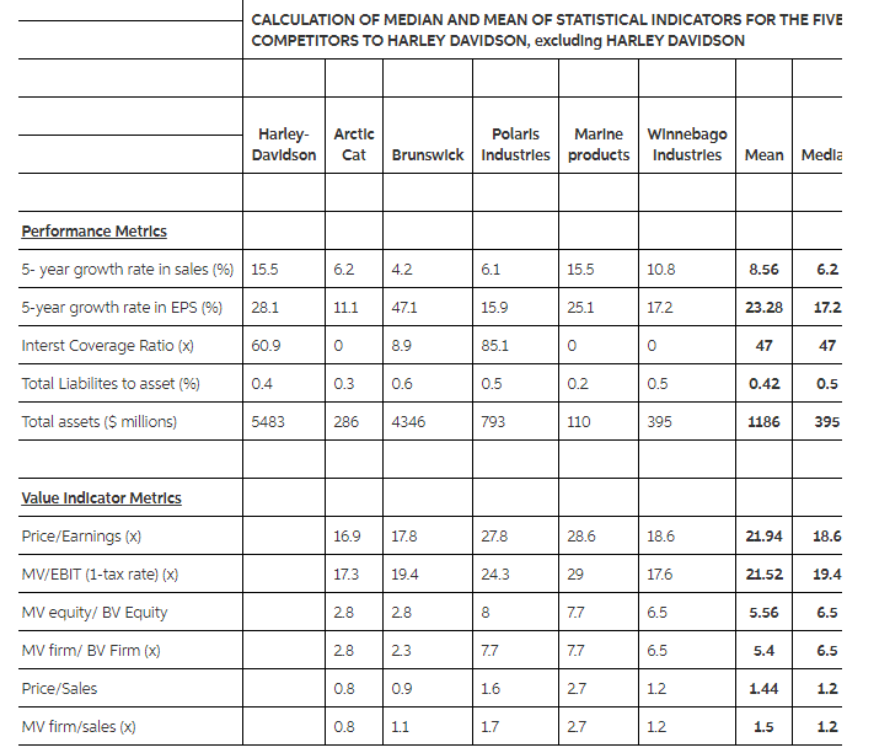
3. Develop a range of values for Harley's stock based on the selected value metric. Support and defend your value range. Harley-Davidson Inc. produces motorcycles, motorcycle parts and related accessories and merchandise in the United States and intemationally. It is headquartered in Milwaukee, Wisconsin. Use the following information on Harley-Davidson and five other similar companies to value Harley-Davidson as of December 31, 2004 Harley-Davidson Inc. 2004 (S millions) 889.77 294.31 Eamings before interest and tax1,506.16 Net income Number of common shares, millions Tax rate 35.0% S 3,218.47 Book value interest-bearing debt 1,295.44 S 5,320.45 S 5483.29 Book value of equity Total Sales Total Assets Harley Davidson Arctic Polaris Marine Winnebago Cat Brunswick Industries Products Industries Comparison of Timberland with Comparable Companies Growth Rates, Financial Risks, Size, Retums 15.5 28.1 60.9 0.4 5,483 6.2 11.1 15.5 25.1 6.1 15.9 85.1 0.5 793 10.8 17.2 5-year growth rate in sales (%) 5-year growth rate in eps (96) Interest coverage ratio (x) Total liabilities to assets (%) Total assets ($ millions) 47.1 8.9 0.6 4.346 0.3 286 0.2 110 0.5 395 Price/eamings (x) MV firm/EBIT(1-tax rate) (x) MV equitylBV equity (x) MV frm/BV firm (x) Price/sales (x) MV firm/sales (x) Indicators of Value 16.9 17.3 2.8 2.8 0.8 0.8 17.8 19.4 2.8 2.3 0.9 28.6 29.0 7.7 7.7 2.7 2.7 27.8 24.3 8.0 18.6 17.6 6.5 6.5 These companies have little or no interest-bearing debt outstanding CALCULATION OF MEDIAN AND MEAN OF STATISTICAL INDICATORS FOR THE FIVE COMPETITORS TO HARLEY DAVIDSON, excluding HARLEY DAVIDSON Harley Arctic Davldson Cat Brunswick Industrles products Industrles Mean Medla PolarlsMarlneWInnebago 15.5 5-year growth rate in sales (%) | 155 5-year growth rate in EPS (%) | 281 Interst Coverage Ratio (x) Total Liabilites to asset (96) Total assets ($ millions) 6.2 4.2 10.8 6.2 23.2817.2 47 8.56 11.1 471 15.9 85.1 0.5 793 25.1 17.2 60.9 0.4 5483 8.9 47 0.3 0.6 0.2 0.5 0.42 0.5 286 4346 110 395 1186 395 27.8 24.3 8 Price/Earnings (x) MV/EBIT (1-tax rate) (x) MV equity/ BV Equity MV firm/ BV Firm (x) Price/Sales MV firm/sales (x) 16.9 17.8 17.3 19.4 2.8 28 23 0.8 0.9 0.8 11 28.6 18.6 17.6 6.5 6.5 1.2 1.2 21.9418.6 21.52 19.4 6.5 6.5 29 2.8 5.56 5.4 1.44 1.5 1.6 2.7 1.2 27 3. Develop a range of values for Harley's stock based on the selected value metric. Support and defend your value range. Harley-Davidson Inc. produces motorcycles, motorcycle parts and related accessories and merchandise in the United States and intemationally. It is headquartered in Milwaukee, Wisconsin. Use the following information on Harley-Davidson and five other similar companies to value Harley-Davidson as of December 31, 2004 Harley-Davidson Inc. 2004 (S millions) 889.77 294.31 Eamings before interest and tax1,506.16 Net income Number of common shares, millions Tax rate 35.0% S 3,218.47 Book value interest-bearing debt 1,295.44 S 5,320.45 S 5483.29 Book value of equity Total Sales Total Assets Harley Davidson Arctic Polaris Marine Winnebago Cat Brunswick Industries Products Industries Comparison of Timberland with Comparable Companies Growth Rates, Financial Risks, Size, Retums 15.5 28.1 60.9 0.4 5,483 6.2 11.1 15.5 25.1 6.1 15.9 85.1 0.5 793 10.8 17.2 5-year growth rate in sales (%) 5-year growth rate in eps (96) Interest coverage ratio (x) Total liabilities to assets (%) Total assets ($ millions) 47.1 8.9 0.6 4.346 0.3 286 0.2 110 0.5 395 Price/eamings (x) MV firm/EBIT(1-tax rate) (x) MV equitylBV equity (x) MV frm/BV firm (x) Price/sales (x) MV firm/sales (x) Indicators of Value 16.9 17.3 2.8 2.8 0.8 0.8 17.8 19.4 2.8 2.3 0.9 28.6 29.0 7.7 7.7 2.7 2.7 27.8 24.3 8.0 18.6 17.6 6.5 6.5 These companies have little or no interest-bearing debt outstanding CALCULATION OF MEDIAN AND MEAN OF STATISTICAL INDICATORS FOR THE FIVE COMPETITORS TO HARLEY DAVIDSON, excluding HARLEY DAVIDSON Harley Arctic Davldson Cat Brunswick Industrles products Industrles Mean Medla PolarlsMarlneWInnebago 15.5 5-year growth rate in sales (%) | 155 5-year growth rate in EPS (%) | 281 Interst Coverage Ratio (x) Total Liabilites to asset (96) Total assets ($ millions) 6.2 4.2 10.8 6.2 23.2817.2 47 8.56 11.1 471 15.9 85.1 0.5 793 25.1 17.2 60.9 0.4 5483 8.9 47 0.3 0.6 0.2 0.5 0.42 0.5 286 4346 110 395 1186 395 27.8 24.3 8 Price/Earnings (x) MV/EBIT (1-tax rate) (x) MV equity/ BV Equity MV firm/ BV Firm (x) Price/Sales MV firm/sales (x) 16.9 17.8 17.3 19.4 2.8 28 23 0.8 0.9 0.8 11 28.6 18.6 17.6 6.5 6.5 1.2 1.2 21.9418.6 21.52 19.4 6.5 6.5 29 2.8 5.56 5.4 1.44 1.5 1.6 2.7 1.2 27
Step by Step Solution
There are 3 Steps involved in it

Get step-by-step solutions from verified subject matter experts