

Question: Question Data Table: Tables: Consider how Hope Valley, a popular ski resort, could use capital budgeting to decide whether the $9.5 million River Park Lodge
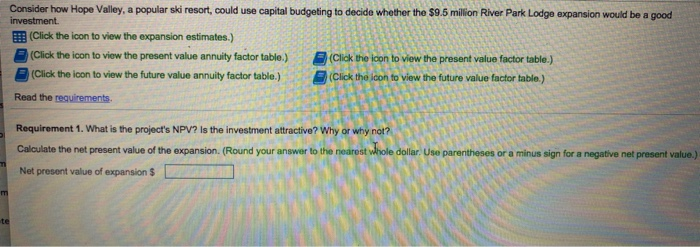
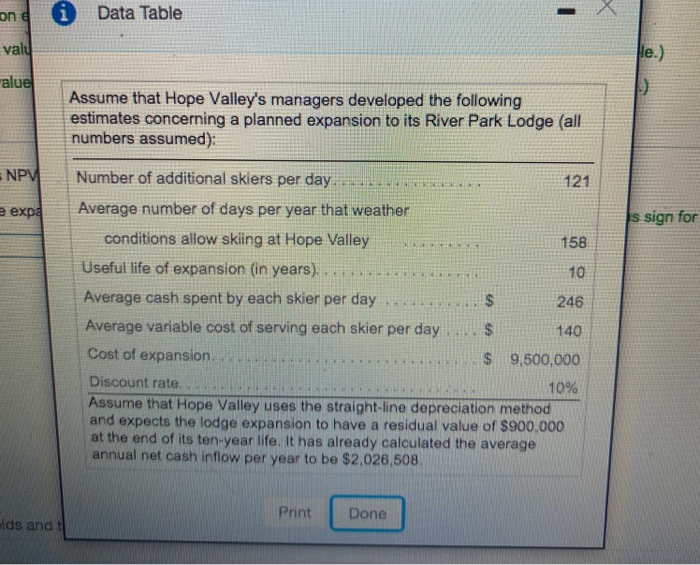
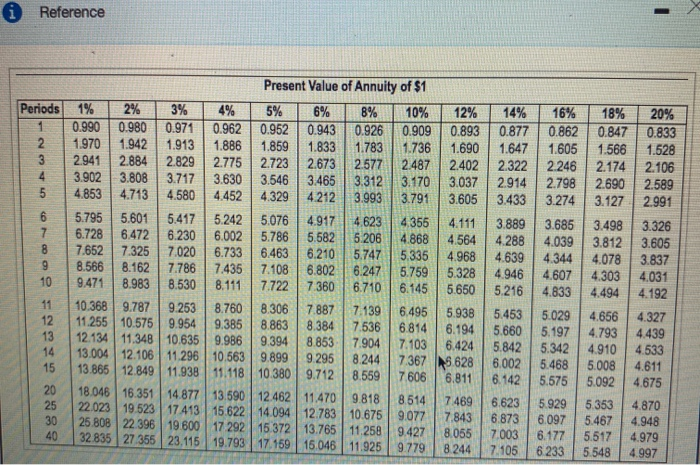
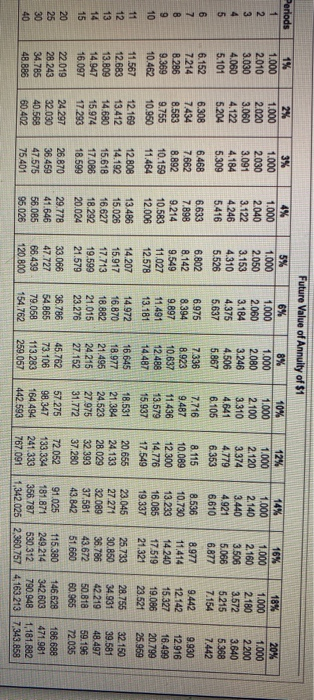
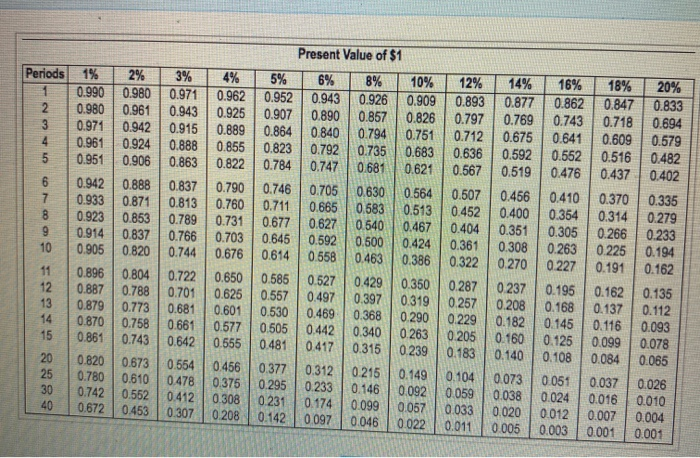
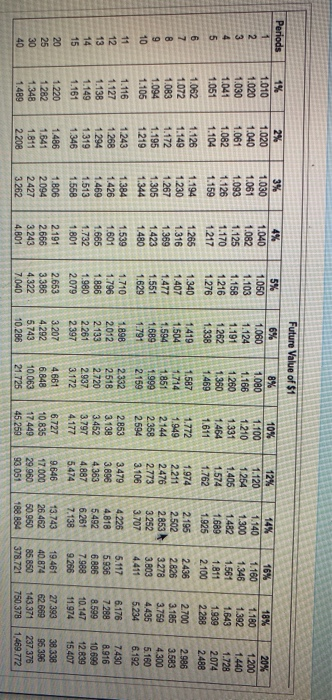
Consider how Hope Valley, a popular ski resort, could use capital budgeting to decide whether the $9.5 million River Park Lodge expansion would be a good investment (Click the icon to view the expansion estimates.) (Click the icon to view the present value annuity factor table.) (Click the icon to view the present value factor table.) (Click the icon to view the future value annuity factor table.) (Click the loon to view the future value factor table.) Read the requirements. Requirement 1. What is the project's NPV? Is the investment attractive? Why or why not? Calculate the net present value of the expansion. (Round your answer to the nearest Whole dollar. Use parentheses or a minus sign for a negative net present value.) Net present value of expansion $ te on i Data Table valy le.) alue) Assume that Hope Valley's managers developed the following estimates concerning a planned expansion to its River Park Lodge (all numbers assumed); NPM 2 exp4 Is sign for + .. Number of additional skiers per day. 121 Average number of days per year that weather conditions allow skiing at Hope Valley 158 Useful life of expansion (in years). 10 Average cash spent by each skier per day $ 246 Average variable cost of serving each skier per day $ 140 Cost of expansion $ 9,500,000 Discount rate 10% Assume that Hope Valley uses the straight-line depreciation method and expects the lodge expansion to have a residual value of $900.000 at the end of its ten-year life. It has already calculated the average annual net cash inflow per year to be $2,026,508. Print Done elds and * Reference Periods 2% 8% 2 3 4 5 6 7 8 9 10 Present Value of Annuity of $1 1% 3% 4% 5% 6% 10% 12% 0.990 0.980 0.971 0.962 0.952 0.943 0.926 0.909 0.893 1.970 1.942 1.913 1.886 1.859 1.833 1.783 1.736 1.690 2.941 2.884 2.829 2.775 2.723 2.673 2.577 2.487 2.402 3.902 3.808 3.717 3.630 3.546 3.465 3.312 3.170 3.037 4.853 4.713 4.580 4.452 4.329 4.2123.993 3.791 3.605 5.795 5.601 5.417 5.242 5.076 4.917 4.623 4355 4.111 6.728 6.472 6.230 6.0025.786 5.582 5.206 4.868 4.564 7.652 7.3257.020 6.733 6.463 6.210 5.747 5.335 4.968 8.566 8.1627.786 7.435 7.108 6.8026.247 5.759 5.328 9.471 8.983 8.530 8.111 7.722 7360 6.710 6.145 5.650 10.3689.787 9.253 8.760 8.306 7.887 7.139 6.495 5.938 11.255 10.575 9.954 9.385 8.863 8.384 7.536 6.814 6.194 12.134 11.348 10.635 9.986 9.394 8.853 7.904 7.103 6.424 13.004 12.106 11.296 10.563 9.899 9.295 8.244 7.367 MS 628 13.865 12.849 11.938 11.11810.380 9.712 8.559 7 606 6.811 18.046 16.351 14.877 13.590 12.462 11.470 9.818 8.514 7.469 22.023 19.52317413 15 622 14.094 12.783 10.675 9.077 7.843 25 808 22396 19600 17 292 15 372 13.765 11.258 9.427 8.055 32835 27 355 23.115 19.793 17.159 15.046 11.925 9.779 8 244 14% 16% 18% 20% 0.877 0.862 0.847 0.833 1.647 1.605 1.566 1.528 2.322 2.246 2.174 2.106 2.914 2.798 2.690 2.589 3.433 3.274 3.127 2.991 3.889 3.685 3.498 3.326 4.288 4.039 3.812 3.605 4.639 4.344 4.078 3.837 4.946 4.607 4.303 4.031 5.216 4.833 4.494 4.192 5.453 5.029 4.656 4.327 5.660 5.1974.793 4.439 5.842 5.3424.910 4.533 6.002 5.468 5.008 4.611 6.142 5.575 5.092 4.675 6.623 5.929 5.353 4.870 6.873 6.097 5.467 4.948 7.003 6.177 5.517 4.979 7.1056 233 5.548 4.997 11 12 13 14 15 20 25 30 40 Periods 1 2 3 4 5 2% 1.000 2020 3.060 4.122 5.204 3% 1.000 2030 3.091 4.184 5.309 6.468 7.662 8.892 10.159 11.484 12% 1.000 2.120 3.374 4.779 6.353 1% 1.000 2.010 3.030 4.060 5.101 6.152 7.214 8.286 9.369 10.462 11.567 12.683 13.809 14.947 16.097 6 7 6.308 7.434 8.583 9 10 9.755 10.950 1.000 2.040 3.122 4246 5.416 6.633 7.898 9.214 10.583 12.006 13.486 15.028 16.627 18.292 20.024 29.778 41.646 56.085 95.026 Future Value of Annuity of $1 5% 6% 8% 10% 1.000 1.000 1.000 1.000 2.050 2060 2.080 2.100 3.153 3.184 3.246 3.310 4.310 4.375 4.506 4.641 5.526 5.637 5.867 6.105 6.802 6.975 7336 7.716 8.142 8.394 8.923 9.487 9.549 9.897 10.637 11436 11.027 11.491 12.488 13.579 12.578 13.181 14487 15.937 14.207 14.972 16.645 18.531 15.917 16.870 18.977 21.384 17.713 18.882 21.495 24.523 19.599 21.015 24.215 27.975 21.579 23.276 27.152 31.772 33.066 36.786 45.762 57 275 47.727 54.865 73.106 98.347 66.439 79.058 113.283 164 494 120.800 154,762 259.067 442 593 14% 16% 18% 20% 1.000 1.000 1.000 1.000 2.140 2.160 2.180 2 200 3.440 3.506 3.572 3.640 4.921 5.066 5.215 5.368 6.610 6.877 7.154 7.442 8.536 8.977 9.442 9.930 10.730 11.414 12.142 12.916 13.233 14 240 15.327 16.499 16.085 17 519 19.086 20.799 19.337 21,321 23.521 25.969 23.045 25.733 28.755 32.150 27 271 30.850 34.931 39.581 32089 36.786 42.219 48.497 37 581 43.672 50.818 59.196 43.842 51.660 60.965 72.035 91.025 115.380 146.628 186.688 181.871 249.214 342.603 471.981 356.787 530.312 790.948 1,181.882 1,342.025 2,360.757 4,163.2137.343.858 11 12 13 14 15 12.169 13.412 14.680 15.974 17.296 24.297 32.030 40.568 60.402 8.115 10.069 12 300 14.776 17.549 20.655 24.133 28.029 32 393 37.280 72.052 133.334 241.333 767.091 12.808 14.192 15.618 17.086 18.599 26.870 36.459 47.575 75.401 20 25 30 40 22.019 28.243 34.785 48.886 Present Value of $1 Periods 2 3 10% 12% 0.909 0.693 0.826 0797 0.751 0712 0.683 0.636 1.621 0.567 5 D 7 (1) 9 10 28 3% 4% 5% 0.990 0960 0971 0962 0.952 0.960 0961 0.943 0.925 0.907 0.97] 0942 0.915 0.889 0.864 0961 0924 4.868 | 0.855 0.823 0961 0906 0663 | 0.822 0.784 0.942 10.888 0.837 0.790 0.746 0933 0.87] 0.813 0.760 0.711 0923 0.853 0789 0.731 0677 0914 0637 0766 | 0.703 | 0645 0905 0820 | 0.744 0.676 0614 0696 | 0.604 0.722 10.650 0565 0.867 0.786 0701 0625 0.567 0879 0.773 068 0601 0530 0.870 0.758 0661 0.577 0505 0.86] 0.743 0642 0655 0481 1 820 0673 0554 10456 0377 0.780 0610 0478 0.375 0295 0742 0552 0412 0306 023 0.672 0453 0307 0208 0.142 6% 6% 0.943 0926 0.690 0.857 0840 0.794 0792 0.735 0.747 0.68] 0705 0630 0665 1583 0.627 0540 0.592 0 500 0658 0.463 0527 0.429 0.497 10397 0469 0.368 0442 0340 0417 0315 0.312 0215 0233 0.146 0 174 1099 0 097 0046 0564 0513 10.467 0.424 0.36 4% 16% 16% 20% 0877 0.862 0.847 0833 0.769 0.743 0716 0.694 0.675 0.641 0.60g 0579 0.592 0.652 0.516 0.482 0.519 0476 0.437 0402 0.456 0410 0.370 0.335 0400 0354 0.314 0279 0.35] 0.305 0266 0233 0.306 0263 0225 0 194 0270 0227 0.191 0.162 0237 0.195 0.162 0.135 0208 | 0.166 0.137 0.112 0.182 0.145 0.116 0093 0 160 0 25 0099 0078 0.140 0 106 0034 0.065 0073 005 0.037 0026 0.038 0024 0.016 a010 0020 2012 4007 2004 0 005 0003 0 001 2001 12 13 4 15 20 25 30 A0 0.507 0452 0.404 0.36 0.322 0267 0257 0229 0205 013 004 1059 0033 0.011 0.350 0319 0.290 0263 0239 0.149 0092 005/ 0022 Future Value of $1 Periods 2 3 4 5 1% 1.010 1.020 1.030 1.041 1.051 1.062 1.072 1.083 1.094 1.105 2% 1.020 1.040 1.061 1.082 1.104 3% 1.030 1.061 1.093 1.126 1.159 4% 1.040 1.082 1.125 1.170 1.217 1.265 1.316 1.369 1.423 1.480 5% 1.050 1.103 1.158 1.216 1.276 8% 1.080 1.166 1.260 1.350 1.469 6 7 8 1.340 1.407 1.477 1.551 1.629 6% 1.060 1.124 1.191 1.262 1.338 1.419 1.504 1.594 1.689 1.791 1.898 2.012 2.133 2261 2397 18% 1.180 1.392 1.643 1.939 2288 2700 3.185 3.759 4435 5.234 1.126 1.149 1.172 1.195 1.219 1.243 1.268 1.294 1.319 1.346 10% 1.100 1.210 1.331 1.464 1.611 1.772 1.949 2144 2.358 2594 2.853 3.138 3.452 3.797 4.177 12% 1.120 1.254 1.405 1.574 1.762 1.974 2.211 2.476 2.773 3.106 3.479 3.896 4383 4.887 5.474 1.194 1.230 1.267 1.305 1.344 1.384 1.426 1.469 1.513 1.568 1.806 2094 2427 3.262 1.587 1.714 1.851 1.999 2.159 2332 2.518 2.720 2.937 3.172 10 14% 1.140 1.300 1.482 1.689 1.925 2.195 2.502 2.853 3.252 3.707 4.226 4,818 5492 6.261 7.138 16% 1.160 1.346 1.561 1.811 2.100 2436 2.826 3278 3.803 4.411 5.117 5.936 6.886 7.988 9.266 19.461 40.874 85.850 378.721 20% 1.200 1.440 1.728 2074 2489 2.986 3.583 4.300 5.160 6.192 7.430 8.916 10.699 12.839 15.407 38.338 95.396 237.376 1.469.772 11 12 13 14 15 1.116 1.127 1.138 1.149 1.161 1.220 1 282 1.348 1.489 1.539 1.601 1.665 1.732 1.801 2.191 2666 3.243 4.801 1.710 1.796 1.886 1.980 2.079 2.653 3.386 4.322 7.040 6.176 7.288 8.599 10.147 11.974 20 25 30 40 1.486 1.641 1.811 2.208 3.207 4.292 5.743 10.286 4.661 6.848 10.063 21.725 6.727 10.836 17.449 45.259 9.646 17.000 29.960 93.051 13.743 26.462 50.950 188.884 27.393 62.669 143.371 750.378
Step by Step Solution
There are 3 Steps involved in it

Get step-by-step solutions from verified subject matter experts