

Question: question: estimate the future cash flow and determine the current value of the firm using NPV Operating Results: Revenue Less: Cost of Goods Sold Gross
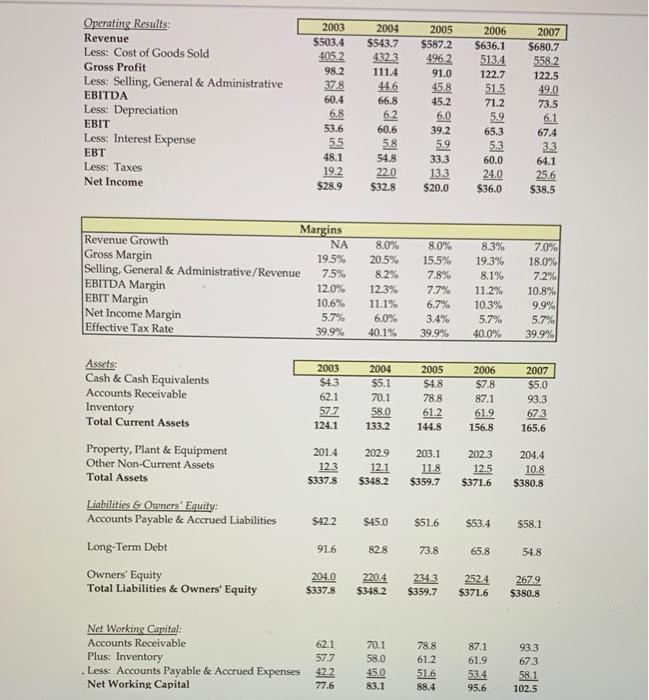
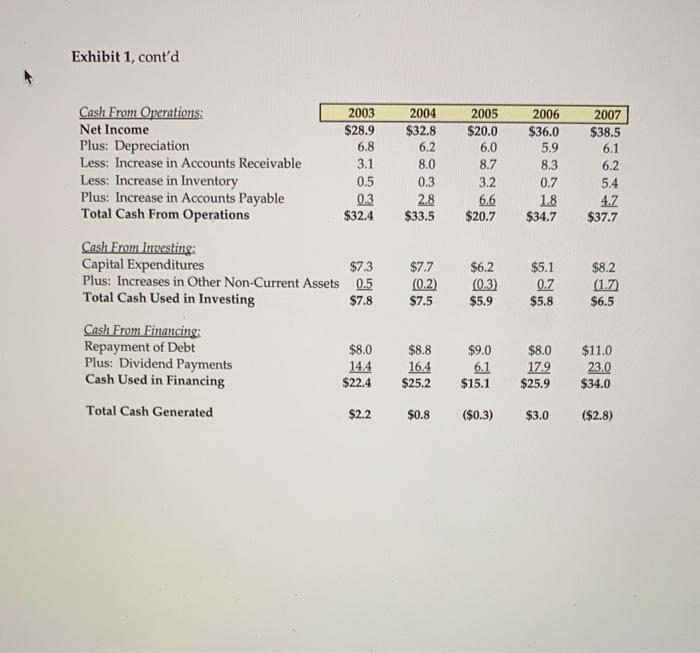
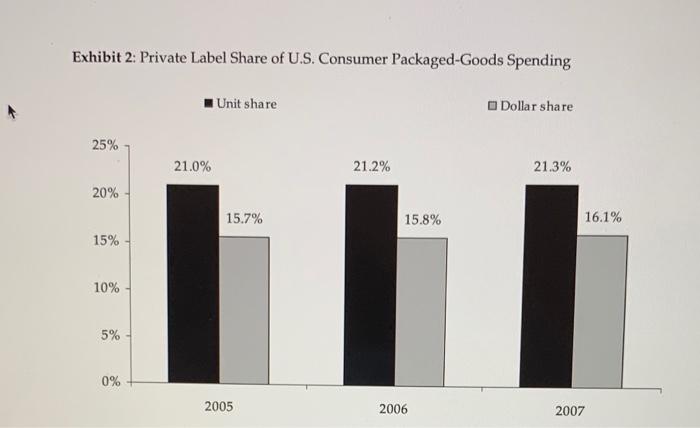
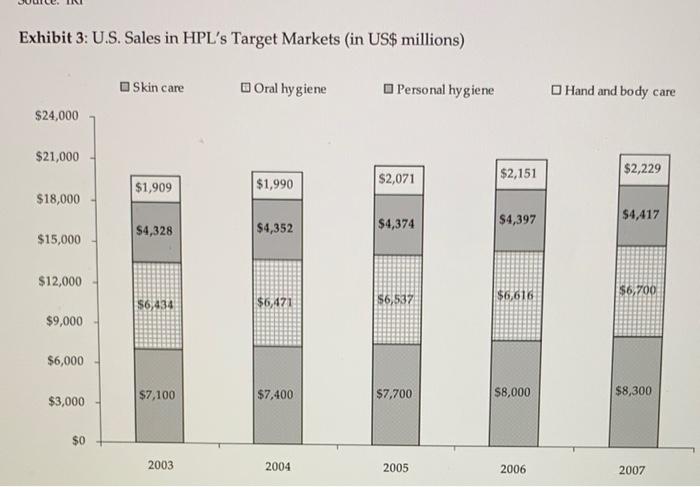
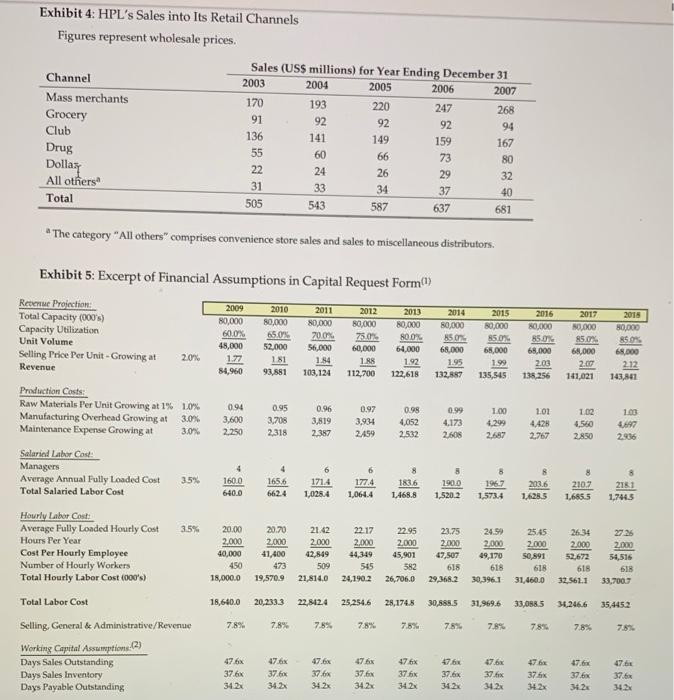
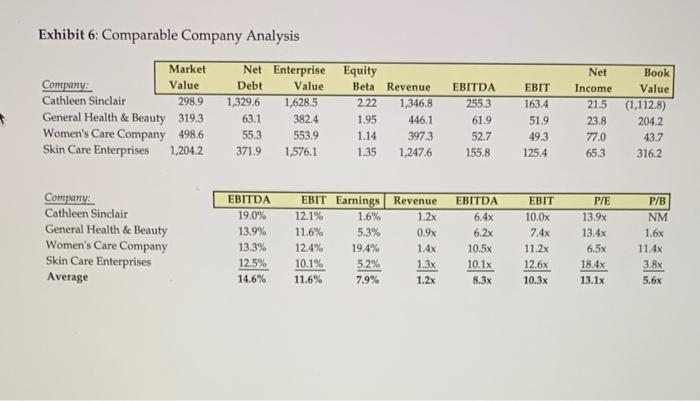
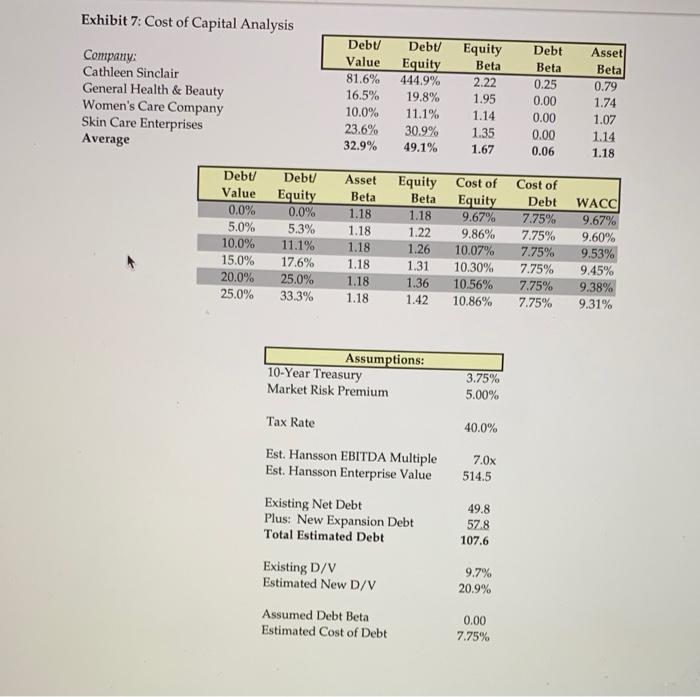
Operating Results: Revenue Less: Cost of Goods Sold Gross Profit Less: Selling, General & Administrative EBITDA Less: Depreciation EBIT Less: Interest Expense EBT Less: Taxes Net Income 2003 $503.4 405.2 98.2 378 60.4 6.8 53.6 55 48.1 19.2 $28.9 2004 $543.7 432.3 111.4 446 66.8 6.2. 60.6 58 54.8 22.0 $32.8 2005 $5872 4962 91.0 45,8 45.2 6,0 39.2 59 33.3 133 $20.0 2006 $636.1 513.4 122.7 51.5 71.2 5.9 65.3 5.3 60.0 24.0 $36.0 2007 $680.7 558.2 122.5 49.0 73.5 6.1 67.4 3.3 64.1 25.6 $38.5 Margins Revenue Growth NA Gross Margin 19.5% Selling, General & Administrative/Revenue 7.5% EBITDA Margin 12.0% EBIT Margin 10.6% Net Income Margin 5.7% Effective Tax Rate 39.9% 8.0% 20.5% 8.2% 12.3% 11.1% 6.0% 40.1% 8.0% 15.5% 7.8% 7.7% 6.7% 3.4% 39.9% 8.3% 19.3% 8.1% 11.2% 10.3% 5.7% 40.0% 7.0% 18.0% 7.2% 10.8% 9.9% 5.7% 39.9% 2003 54.3 621 577 124.1 2004 $5.1 70.1 58.0 133.2 2005 $4.8 78.8 61.2 144.8 2006 $7.8 87.1 61.9 156.8 2007 $5.0 93.3 67.3 165.6 Assets Cash & Cash Equivalents Accounts Receivable Inventory Total Current Assets Property, Plant & Equipment Other Non-Current Assets Total Assets Liabilities & Owners' Equity: Accounts Payable & Accrued Liabilities Long-Term Debt Owners' Equity Total Liabilities & Owners' Equity 201.4 123 $337.8 2029 12.1 $348.2 203.1 11.8 $359.7 202.3 12.5 $371.6 204.4 10.8 $380.8 $422 $45.0 $51.6 $53.4 $58.1 91.6 828 73.8 65.8 54.8 204.0 $337.8 2204 $345.2 2343 $359.7 252.4 $371.6 2679 $380.8 Net Working Capital: Accounts Receivable 62.1 Plus: Inventory 577 .Less: Accounts Payable & Accrued Expenses 422 Net Working Capital 77.6 70.1 58.0 45.0 83.1 78.8 612 51.6 88.4 87.1 61.9 53.4 95.6 93.3 67.3 58.1 102.5 Exhibit 1, conta 2007 $38.5 2004 $32.8 6.2 8.0 0.3 2.8 $33.5 6.1 2005 $20.0 6.0 8.7 3.2 6,6 $20.7 2006 $36.0 5.9 8.3 0.7 6.2 5.4 4.7 $37.7 1.8 $34.7 Cash From Operations 2003 Net Income $28.9 Plus: Depreciation 6.8 Less: Increase in Accounts Receivable 3.1 Less: Increase in Inventory 0.5 Plus: Increase in Accounts Payable 0.3 Total Cash From Operations $32.4 Cash From Investing: Capital Expenditures $7.3 Plus: Increases in Other Non-Current Assets 0.5 Total Cash Used in Investing $7.8 Cash From Financing: Repayment of Debt $8.0 Plus: Dividend Payments 14.4 Cash Used in Financing $22.4 Total Cash Generated $2.2 $7.7 (0.2) $7.5 $6.2 (0.3 $5.9 $5.1 0.7 $5.8 $8.2 (1.7) $6.5 $8.8 16.4 $25.2 $9.0 6.1 $15.1 $8.0 179 $25.9 $11.0 23.0 $34.0 $0.8 ($0.3) $3.0 ($2.8) Exhibit 2: Private Label Share of U.S. Consumer Packaged-Goods Spending Unit share Dollar share 25% 21.0% 21.2% 21.3% 20% 15.7% 15.8% 16.1% 15% 10% 5% 0% 2005 2006 2007 Exhibit 3: U.S. Sales in HPL's Target Markets (in US$ millions) Skin care Oral hygiene Personal hygiene Hand and body care $24,000 $21,000 $2,151 $2,229 $2,071 $1,909 $1,990 $18,000 $4,417 $4,328 $4,352 $4,397 $4,374 $15,000 $12,000 $6,700 $6,471 $6,616 $6,434 $6,537 $9,000 $6,000 $7,100 $7,400 $7,700 $8,000 $3,000 $8,300 2003 2004 2005 2006 2007 Exhibit 4: HPL's Sales into Its Retail Channels Figures represent wholesale prices. Sales (US$ millions) for Year Ending December 31 Channel 2003 2004 2005 2006 2007 Mass merchants 170 193 220 247 268 Grocery 91 92 92 92 94 Club 136 141 149 159 167 Drug 55 60 66 73 80 Dollar 22 24 26 29 32 All others 31 33 34 37 40 Total 505 543 587 637 681 The category "All others" comprises convenience store sales and sales to miscellaneous distributors. 2015 80,000 85.0% 68,000 199 135,545 2016 80,000 85.0% 68,000 2.03 138,256 2017 0.000 85.0% 64,000 2.00 141,021 2018 80,000 85. 68.000 212 143,841 3.0% 1.00 4299 2.687 1.01 4,428 2,767 1.02 4,560 2.850 1.03 4697 2936 Exhibit 5: Excerpt of Financial Assumptions in Capital Request Form(1) Retenue Projection: 2009 2010 2011 2012 2013 2014 Total Capacity (000's) 80,000 80,000 80,000 80,000 80,000 Capacity Utilization 80,000 60.0% 65.0% 20.0% Unit Volume 7. 80.0% 850 45,000 52,000 56,000 60,000 64,000 Selling Price Per Unit - Growing at 65.000 20% 1.77 181 1.54 1.88 1.92 1.95 Revenue 84,960 93,881 103,124 112,700 122,618 132.887 Production Costs Raw Materials Per Unit Growing at 1% 0% 094 0.95 0.96 0.97 0.98 0.99 Manufacturing Overhead Growing at 3,600 3.708 3,819 3,934 4,052 4.173 Maintenance Expense Growing at 3.0% 2.250 2,318 2387 2459 2,532 2,608 Salaried Labor Cost: Managers 8 8 Average Annual Fully Loaded Cost 3.5% 160.0 165.6 1714 1774 1836 290.0 Total Salaried Labor Cost 640.0 6624 1,028.4 1,0644 1,468.8 1,520.2 Hourly Labor Cost Average Fully Loaded Hourly Cost 20.00 20.70 21.42 22.17 22.95 23.75 Hours Per Year 2.000 2.000 2.000 2,000 2.000 2.000 Cost Per Hourly Employee 40,000 41,400 42,849 44,349 45,901 47,507 Number of Hourly Workers 450 473 509 545 582 618 Total Hourly Labor Cost 6000's) 18,000.0 19,5709 21,814.0 24,190.2 26,706,0 29,368.2 Total Labor Cost 18,640.0 20.2333 22,8124 25.254.6 28,174.8 30,885.5 Selling, General & Administrative/Revenue 7.8% 7.8% 7.5% 7.8% 7.5% 78% Working Capital Assumptions(2) Days Sales Outstanding 47.6% 47.6% 476 47.6% 476 Days Sales Inventory 37.6% 37.6% 37.6% 37.6 376x 37.box Days Payable Outstanding 34.22 34.2 342x 34.2x 34.2% 8 1967 1,5734 203.6 1.6255 2107 1,6855 2181 1,744.5 24.5 2.000 49,170 618 30,396.1 25:45 2.000 50,891 618 31,460.0 26,34 2,000 52,672 618 32.561.1 27.26 2.000 54,516 618 33,700, 31.969.6 33,058.5 31.246.6 35.445.2 7.8% 7.896 78% 7.8% 476 37.box 376 47.6% 37.6% 32 47. 37.6% 342 3423 32 Exhibit 6: Comparable Company Analysis Market Company: Value Cathleen Sinclair 298.9 General Health & Beauty 319.3 Women's Care Company 498.6 Skin Care Enterprises 1,204.2 Net Enterprise Equity Debt Value Beta Revenue 1,329.6 1,628.5 2.22 1,346,8 63.1 382.4 1.95 446.1 55.3 553.9 1.14 397.3 371.9 1,576.1 1.35 1,247.6 EBITDA 255.3 61.9 52.7 155.8 EBIT 163.4 51.9 49.3 125.4 Net Income 21.5 23.8 77.0 65.3 Book Value (1,112.8) 204.2 43.7 316.2 Comparty: Cathleen Sinclair General Health & Beauty Women's Care Company Skin Care Enterprises Average EBITDA 19.0% 13.9% 13.3% 12.5% 14.6% EBIT Earnings Revenue 12.1% 1.6% 1.2x 11.6% 5.3% 0.9x 12.4% 19.4% 1.4x 10.1% 5.2% 1.3x 11.6% 7.9% 1.2x EBITDA 6.4x 6.2x 10,5x 10.1x 8.3x EBIT 10.0x 7.4x 11.2x 12.6x 10.3x P/E 13.9x 13.4x 6.5x 18.4x 13.1x P/B NM 1.6x 11.4x 3.8x 5.6x Exhibit 7: Cost of Capital Analysis Company: Cathleen Sinclair General Health & Beauty Women's Care Company Skin Care Enterprises Average Debt/ Value 81.6% 16.5% 10.0% 23.6% 32.9% Debt Equity 444.9% 19.8% 11.1% 30.9% 49.1% Equity Beta 2.22 1.95 1.14 1.35 1.67 Debt Beta 0.25 0.00 0.00 0.00 0.06 Asset Beta 0.79 1.74 1.07 1.14 1.18 Debt Value 0.0% 5.0% 10.0% 15.0% 20.0% 25.0% Debt Equity 0.0% 5.3% 11.1% 17.6% 25.0% 33.3% Asset Beta 1.18 1.18 1.18 1.18 1.18 1.18 Equity Beta 1.18 1.22 1.26 1.31 1.36 1.42 Cost of Equity 9.67% 9.86% 10.07% 10.30% 10.56% 10.86% Cost of Debt 7.75% 7.75% 7.75% 7.75% 7.75% 7.75% WACC 9.67% 9.60% 9.53% 9.45% 9.38% 9.31% Assumptions: 10-Year Treasury Market Risk Premium 3.75% 5.00% Tax Rate 40.0% Est. Hansson EBITDA Multiple Est. Hansson Enterprise Value 7.0x 514.5 Existing Net Debt Plus: New Expansion Debt Total Estimated Debt Existing D/V Estimated New D/V 49.8 57.8 107.6 9.7% 20.9% Assumed Debt Beta Estimated Cost of Debt 0.00 7.75% Operating Results: Revenue Less: Cost of Goods Sold Gross Profit Less: Selling, General & Administrative EBITDA Less: Depreciation EBIT Less: Interest Expense EBT Less: Taxes Net Income 2003 $503.4 405.2 98.2 378 60.4 6.8 53.6 55 48.1 19.2 $28.9 2004 $543.7 432.3 111.4 446 66.8 6.2. 60.6 58 54.8 22.0 $32.8 2005 $5872 4962 91.0 45,8 45.2 6,0 39.2 59 33.3 133 $20.0 2006 $636.1 513.4 122.7 51.5 71.2 5.9 65.3 5.3 60.0 24.0 $36.0 2007 $680.7 558.2 122.5 49.0 73.5 6.1 67.4 3.3 64.1 25.6 $38.5 Margins Revenue Growth NA Gross Margin 19.5% Selling, General & Administrative/Revenue 7.5% EBITDA Margin 12.0% EBIT Margin 10.6% Net Income Margin 5.7% Effective Tax Rate 39.9% 8.0% 20.5% 8.2% 12.3% 11.1% 6.0% 40.1% 8.0% 15.5% 7.8% 7.7% 6.7% 3.4% 39.9% 8.3% 19.3% 8.1% 11.2% 10.3% 5.7% 40.0% 7.0% 18.0% 7.2% 10.8% 9.9% 5.7% 39.9% 2003 54.3 621 577 124.1 2004 $5.1 70.1 58.0 133.2 2005 $4.8 78.8 61.2 144.8 2006 $7.8 87.1 61.9 156.8 2007 $5.0 93.3 67.3 165.6 Assets Cash & Cash Equivalents Accounts Receivable Inventory Total Current Assets Property, Plant & Equipment Other Non-Current Assets Total Assets Liabilities & Owners' Equity: Accounts Payable & Accrued Liabilities Long-Term Debt Owners' Equity Total Liabilities & Owners' Equity 201.4 123 $337.8 2029 12.1 $348.2 203.1 11.8 $359.7 202.3 12.5 $371.6 204.4 10.8 $380.8 $422 $45.0 $51.6 $53.4 $58.1 91.6 828 73.8 65.8 54.8 204.0 $337.8 2204 $345.2 2343 $359.7 252.4 $371.6 2679 $380.8 Net Working Capital: Accounts Receivable 62.1 Plus: Inventory 577 .Less: Accounts Payable & Accrued Expenses 422 Net Working Capital 77.6 70.1 58.0 45.0 83.1 78.8 612 51.6 88.4 87.1 61.9 53.4 95.6 93.3 67.3 58.1 102.5 Exhibit 1, conta 2007 $38.5 2004 $32.8 6.2 8.0 0.3 2.8 $33.5 6.1 2005 $20.0 6.0 8.7 3.2 6,6 $20.7 2006 $36.0 5.9 8.3 0.7 6.2 5.4 4.7 $37.7 1.8 $34.7 Cash From Operations 2003 Net Income $28.9 Plus: Depreciation 6.8 Less: Increase in Accounts Receivable 3.1 Less: Increase in Inventory 0.5 Plus: Increase in Accounts Payable 0.3 Total Cash From Operations $32.4 Cash From Investing: Capital Expenditures $7.3 Plus: Increases in Other Non-Current Assets 0.5 Total Cash Used in Investing $7.8 Cash From Financing: Repayment of Debt $8.0 Plus: Dividend Payments 14.4 Cash Used in Financing $22.4 Total Cash Generated $2.2 $7.7 (0.2) $7.5 $6.2 (0.3 $5.9 $5.1 0.7 $5.8 $8.2 (1.7) $6.5 $8.8 16.4 $25.2 $9.0 6.1 $15.1 $8.0 179 $25.9 $11.0 23.0 $34.0 $0.8 ($0.3) $3.0 ($2.8) Exhibit 2: Private Label Share of U.S. Consumer Packaged-Goods Spending Unit share Dollar share 25% 21.0% 21.2% 21.3% 20% 15.7% 15.8% 16.1% 15% 10% 5% 0% 2005 2006 2007 Exhibit 3: U.S. Sales in HPL's Target Markets (in US$ millions) Skin care Oral hygiene Personal hygiene Hand and body care $24,000 $21,000 $2,151 $2,229 $2,071 $1,909 $1,990 $18,000 $4,417 $4,328 $4,352 $4,397 $4,374 $15,000 $12,000 $6,700 $6,471 $6,616 $6,434 $6,537 $9,000 $6,000 $7,100 $7,400 $7,700 $8,000 $3,000 $8,300 2003 2004 2005 2006 2007 Exhibit 4: HPL's Sales into Its Retail Channels Figures represent wholesale prices. Sales (US$ millions) for Year Ending December 31 Channel 2003 2004 2005 2006 2007 Mass merchants 170 193 220 247 268 Grocery 91 92 92 92 94 Club 136 141 149 159 167 Drug 55 60 66 73 80 Dollar 22 24 26 29 32 All others 31 33 34 37 40 Total 505 543 587 637 681 The category "All others" comprises convenience store sales and sales to miscellaneous distributors. 2015 80,000 85.0% 68,000 199 135,545 2016 80,000 85.0% 68,000 2.03 138,256 2017 0.000 85.0% 64,000 2.00 141,021 2018 80,000 85. 68.000 212 143,841 3.0% 1.00 4299 2.687 1.01 4,428 2,767 1.02 4,560 2.850 1.03 4697 2936 Exhibit 5: Excerpt of Financial Assumptions in Capital Request Form(1) Retenue Projection: 2009 2010 2011 2012 2013 2014 Total Capacity (000's) 80,000 80,000 80,000 80,000 80,000 Capacity Utilization 80,000 60.0% 65.0% 20.0% Unit Volume 7. 80.0% 850 45,000 52,000 56,000 60,000 64,000 Selling Price Per Unit - Growing at 65.000 20% 1.77 181 1.54 1.88 1.92 1.95 Revenue 84,960 93,881 103,124 112,700 122,618 132.887 Production Costs Raw Materials Per Unit Growing at 1% 0% 094 0.95 0.96 0.97 0.98 0.99 Manufacturing Overhead Growing at 3,600 3.708 3,819 3,934 4,052 4.173 Maintenance Expense Growing at 3.0% 2.250 2,318 2387 2459 2,532 2,608 Salaried Labor Cost: Managers 8 8 Average Annual Fully Loaded Cost 3.5% 160.0 165.6 1714 1774 1836 290.0 Total Salaried Labor Cost 640.0 6624 1,028.4 1,0644 1,468.8 1,520.2 Hourly Labor Cost Average Fully Loaded Hourly Cost 20.00 20.70 21.42 22.17 22.95 23.75 Hours Per Year 2.000 2.000 2.000 2,000 2.000 2.000 Cost Per Hourly Employee 40,000 41,400 42,849 44,349 45,901 47,507 Number of Hourly Workers 450 473 509 545 582 618 Total Hourly Labor Cost 6000's) 18,000.0 19,5709 21,814.0 24,190.2 26,706,0 29,368.2 Total Labor Cost 18,640.0 20.2333 22,8124 25.254.6 28,174.8 30,885.5 Selling, General & Administrative/Revenue 7.8% 7.8% 7.5% 7.8% 7.5% 78% Working Capital Assumptions(2) Days Sales Outstanding 47.6% 47.6% 476 47.6% 476 Days Sales Inventory 37.6% 37.6% 37.6% 37.6 376x 37.box Days Payable Outstanding 34.22 34.2 342x 34.2x 34.2% 8 1967 1,5734 203.6 1.6255 2107 1,6855 2181 1,744.5 24.5 2.000 49,170 618 30,396.1 25:45 2.000 50,891 618 31,460.0 26,34 2,000 52,672 618 32.561.1 27.26 2.000 54,516 618 33,700, 31.969.6 33,058.5 31.246.6 35.445.2 7.8% 7.896 78% 7.8% 476 37.box 376 47.6% 37.6% 32 47. 37.6% 342 3423 32 Exhibit 6: Comparable Company Analysis Market Company: Value Cathleen Sinclair 298.9 General Health & Beauty 319.3 Women's Care Company 498.6 Skin Care Enterprises 1,204.2 Net Enterprise Equity Debt Value Beta Revenue 1,329.6 1,628.5 2.22 1,346,8 63.1 382.4 1.95 446.1 55.3 553.9 1.14 397.3 371.9 1,576.1 1.35 1,247.6 EBITDA 255.3 61.9 52.7 155.8 EBIT 163.4 51.9 49.3 125.4 Net Income 21.5 23.8 77.0 65.3 Book Value (1,112.8) 204.2 43.7 316.2 Comparty: Cathleen Sinclair General Health & Beauty Women's Care Company Skin Care Enterprises Average EBITDA 19.0% 13.9% 13.3% 12.5% 14.6% EBIT Earnings Revenue 12.1% 1.6% 1.2x 11.6% 5.3% 0.9x 12.4% 19.4% 1.4x 10.1% 5.2% 1.3x 11.6% 7.9% 1.2x EBITDA 6.4x 6.2x 10,5x 10.1x 8.3x EBIT 10.0x 7.4x 11.2x 12.6x 10.3x P/E 13.9x 13.4x 6.5x 18.4x 13.1x P/B NM 1.6x 11.4x 3.8x 5.6x Exhibit 7: Cost of Capital Analysis Company: Cathleen Sinclair General Health & Beauty Women's Care Company Skin Care Enterprises Average Debt/ Value 81.6% 16.5% 10.0% 23.6% 32.9% Debt Equity 444.9% 19.8% 11.1% 30.9% 49.1% Equity Beta 2.22 1.95 1.14 1.35 1.67 Debt Beta 0.25 0.00 0.00 0.00 0.06 Asset Beta 0.79 1.74 1.07 1.14 1.18 Debt Value 0.0% 5.0% 10.0% 15.0% 20.0% 25.0% Debt Equity 0.0% 5.3% 11.1% 17.6% 25.0% 33.3% Asset Beta 1.18 1.18 1.18 1.18 1.18 1.18 Equity Beta 1.18 1.22 1.26 1.31 1.36 1.42 Cost of Equity 9.67% 9.86% 10.07% 10.30% 10.56% 10.86% Cost of Debt 7.75% 7.75% 7.75% 7.75% 7.75% 7.75% WACC 9.67% 9.60% 9.53% 9.45% 9.38% 9.31% Assumptions: 10-Year Treasury Market Risk Premium 3.75% 5.00% Tax Rate 40.0% Est. Hansson EBITDA Multiple Est. Hansson Enterprise Value 7.0x 514.5 Existing Net Debt Plus: New Expansion Debt Total Estimated Debt Existing D/V Estimated New D/V 49.8 57.8 107.6 9.7% 20.9% Assumed Debt Beta Estimated Cost of Debt 0.00 7.75%
Step by Step Solution
There are 3 Steps involved in it

Get step-by-step solutions from verified subject matter experts