

Question: question final begin{tabular}{|c|c|c|c|c|} hline multicolumn{5}{|c|}{ Balance Sheet Survey } hline & Andrews & Baldwin & Chester & Digby hline Cash & 532:047 &
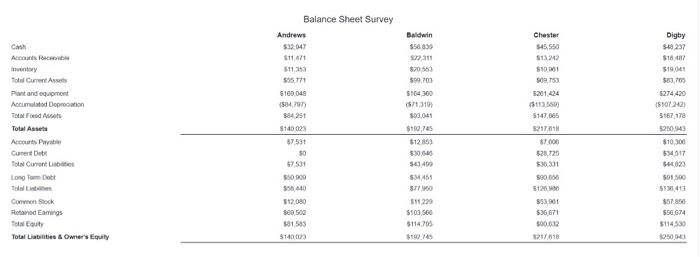
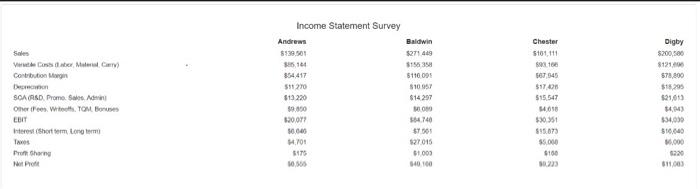
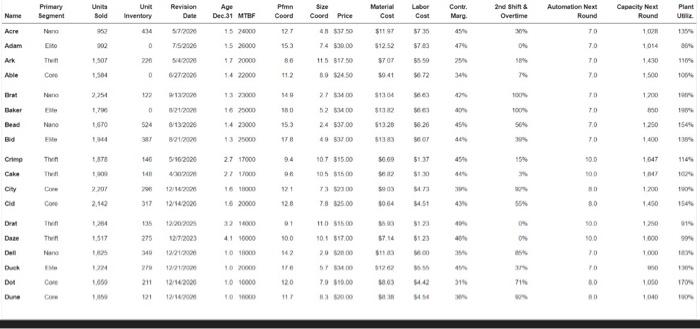
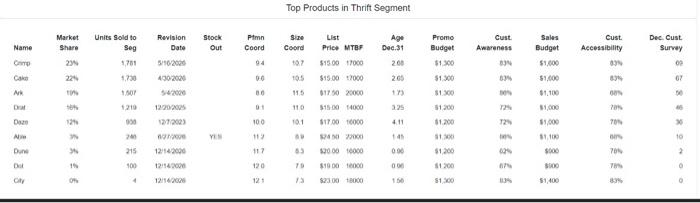
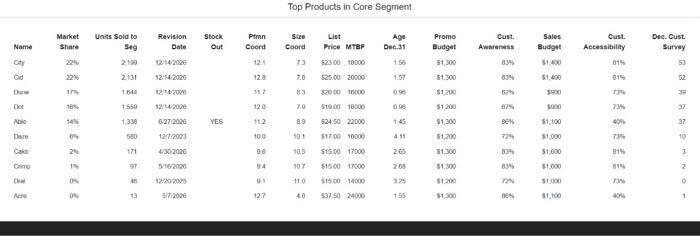
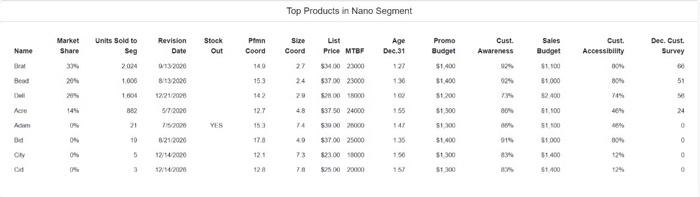
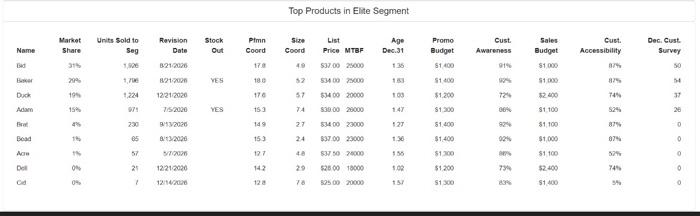
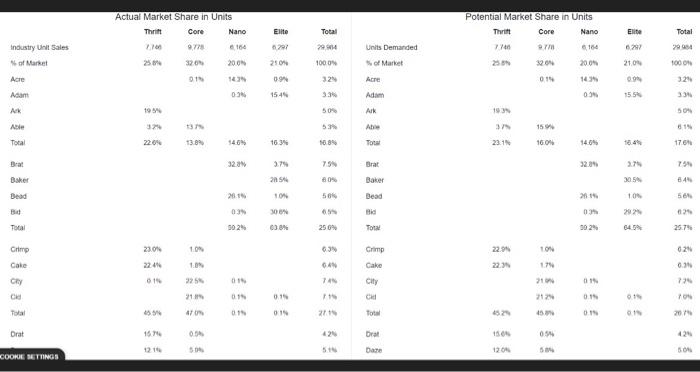
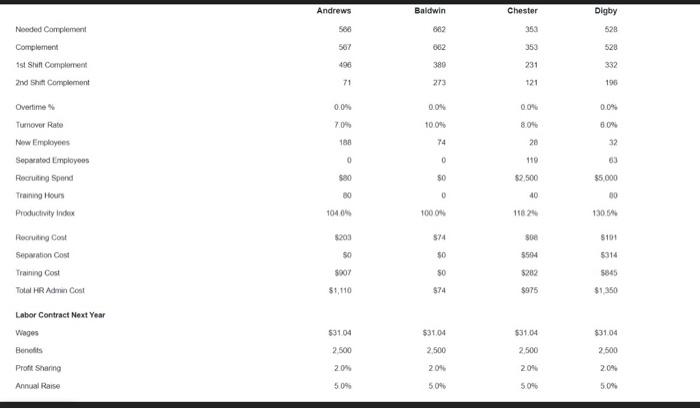
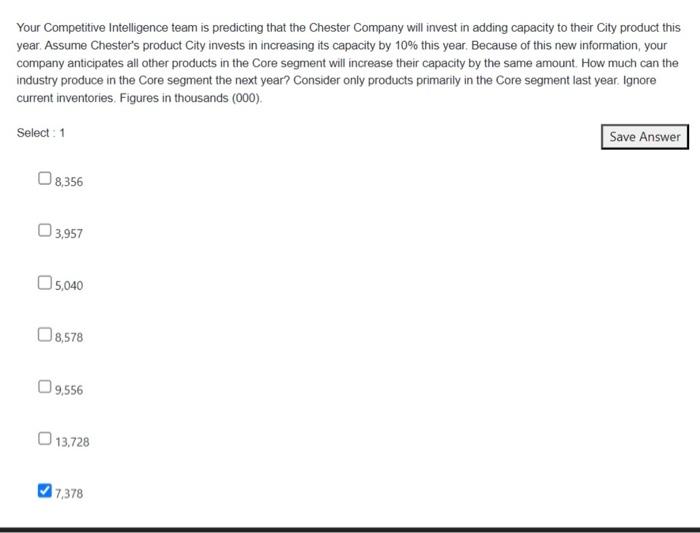
\begin{tabular}{|c|c|c|c|c|} \hline \multicolumn{5}{|c|}{ Balance Sheet Survey } \\ \hline & Andrews & Baldwin & Chester & Digby \\ \hline Cash & 532:047 & & 345,550 & \\ \hline Acrounts Pescroibs & $11,471 & sonans & 513242 & $18,487 \\ \hline imsintory & 311,253 & $20563 & swowi & $19001 \\ \hline fots CumereAsseb & & 590,700 & soerse & 803,65 \\ \hline Plont and equipment & 5169,049 & Sted, 300 & 5201,424 & 5274,420 \\ \hline Accumulstod Doprooanon & (\$, 9) & & (5112500) & (5507,2021 \\ \hline Tatas rosed Asoots. & 3425t & s90,01 & 5147,065 & 5567,173 \\ \hline Total Asseta & $140023 & $190,765 & 2:17.018 & \\ \hline Accicurts Paritien & 87.531 & $12359 & 57.000 & $10,900 \\ \hline Cunere Doth & 50 & $30040 & & 534 317 \\ \hline fots Cument Listitet & & $0,400 & $36.331 & sutan \\ \hline Lono Fom Doet & 580,909 & SM,45s & & 501,500 \\ \hline Tad tintaline & s50,440 & & 5120,100 & 558,413 \\ \hline Conmon Sock. & 512,080 & 511229 & s53,plt & 857.956 \\ \hline Rhenansod Eamirgs & 500,500 & s500,560 & $30,671 & $56,674 \\ \hline Foul Eouty & 841,543 & 5114,705 & & 5114$30 \\ \hline Totat Labilities as Omners Equity & $14000 & stue thes & seston & \\ \hline \end{tabular} \begin{tabular}{|c|c|c|c|c|c|} \hline \multicolumn{6}{|c|}{ Income Statement Survey } \\ \hline & & Andrem & Baldwin & Chester & Digby \\ \hline Seles & & $39,501 & $271.449 & 5+64,41 & $200,500 \\ \hline & * & Mis, 144 & 8155354 & sen160 & $121,000 \\ \hline Contrbutoon Mrron & & $34,417 & $110005 & 500,945 & sra,sog \\ \hline Derancinon & & 5$1270 & $10057 & & $14,295 \\ \hline & & 113220 & $14.297 & 515,547 & 121,013 \\ \hline Other ffees. Whith. Tom Bocises & & sass & moso & Mose & \\ \hline EeIT & & wooft & & $30351 & $34,090 \\ \hline interes ishort serm, tono termi! & & seces & & 595073 & stesess \\ \hline Tanos & & 4.701 & $27.015 & $5.000 & N.000 \\ \hline Prof sharne & & sats & $1.000 & $190 & cos0 \\ \hline Hein Frode & & 10:56s & 540160 & sam & t11,ces \\ \hline \end{tabular} Top Products in Elite Segment \begin{tabular}{|c|c|c|c|c|c|c|c|c|c|c|c|} \hline \multicolumn{6}{|c|}{ Actual Market Share in Units } & \multicolumn{6}{|c|}{ Potential Market Share in Units } \\ \hline & Thrift & Core & Nano & Ellte & Total & & Thrift & Core & Nano & Elite & Total \\ \hline industry Unit sales & 8,100 & & e.160 & 0.201 & 79sin4 & Units Demanded & & & 0.164 & & 2004 \\ \hline Nof Market & 2564 & 3200 & 200s & 2500 & 1000N & th of Market & 250 & 3204 & 2005 & 21.04 & 100cos \\ \hline Acre & & 010 & sen & as & 324 & Acre: & & 0:4 & 1435 & log & 326 \\ \hline Aasm & & & 0.36 & 1545 & 3.3% & Adim & & & & 15.50 & 336 \\ \hline Aok. & toss & & & & 505 & Avk & log & & & & sos \\ \hline Nie & 374 & tg & & & 53% & Abre & 3m & 15% & & & 615 \\ \hline Tocal & 220% & 13.0s & 146s & 1634 & 10.8% & Tonet & 23.1N & 16.0h & 14.0s & t. 45 & 176n \\ \hline Brat & & & 32av & 2 & 75 & Brat & & & & & 250 \\ \hline Bsker & & & & zasth & fos & Baker & & & & 30.5m & 6. 44 \\ \hline Dead & & & & sin & 56% & Besd & & & 2n+5 & 100 & \\ \hline Bint & & & 035 & yoen & ons & Eid & & & om & 2027 & 624 \\ \hline Tocal & & & 502b & cos & 250% & Trax & & & 502b & 64.5% & 25.74 \\ \hline Crimp & non & 100 & & & & Grimp & 22% & 10n & & & 62% \\ \hline Cale & 2246 & 1.00 & & & & Cake & & 10 & & & 0.2n \\ \hline Cry & 616 & & 018 & & & City & & mon & & & \\ \hline cks & & 21.175 & & 0.18 & & cal & & 2120 & 0.18 & & 100 \\ \hline Folal & s & af in & 0.15 & 018 & 2t+5 & total & 420 & & 0ks & & 20m \\ \hline Orat & 1674 & 0.56 & & & 428 & Drat & ises & 054 & & & 420 \\ \hline & & 506 & & & 5+6 & base & 1204 & 5en & & & 50c \\ \hline \end{tabular} \begin{tabular}{|c|c|c|c|c|} \hline & Andrews & Baldwin & Chester & Digby \\ \hline Nooded Complement & 566 & 682 & 353 & 528 \\ \hline Complement & 567 & 062 & 353 & 520 \\ \hline ist Shift Compiarrent & 496 & 380 & 231 & 332 \\ \hline and Shat Comploment & & 273 & 121 & 196 \\ \hline Overtime s & 0.0% & 0.0N & 0.0N & 0.0% \\ \hline Tumever Rabe & 7.0m & 100% & 8.04 & \\ \hline New Employees & 188 & 74 & 28 & 32 \\ \hline Seperatod Limpioyees & 0 & 0 & 110 & 63 \\ \hline Pecrueting Spend & $20 & $0 & $2.500 & $5.000 \\ \hline Trainng tiours & & 0 & 40 & 60 \\ \hline Productivity indox & 1040s & 100os & 11824 & 130.56 \\ \hline Pocruitre Cost & 5203 & 574 & seet & 8104 \\ \hline Sepusation Cost & 50 & 50 & 55sin & $314 \\ \hline Training Cost & 5x07 & so & $282 & 5845 \\ \hline Totel HR Adrin Cost & $1,110 & $74 & $975 & $1,350 \\ \hline \multicolumn{5}{|l|}{ Labor Contract Next Year } \\ \hline Wages & $31.04 & $31.04 & $31.04 & $31.04 \\ \hline Benofits & 2,500 & 2.500 & 2.500 & 2,500 \\ \hline Proth Shanng & 20m & 204 & 20m & 200% \\ \hline Annual Rarse & 509% & & 50% & 5.00% \\ \hline \end{tabular} Your Competitive Intelligence team is predicting that the Chester Company will invest in adding capacity to their City product this year. Assume Chester's product City invests in increasing its capacity by 10% this year. Because of this new information, your company anticipates all other products in the Core segment will increase their capacity by the same amount. How much can the industry produce in the Core segment the next year? Consider only products primarily in the Core segment last year. Ignore current inventories. Figures in thousands (000). Select: 1 8,356 3,957 5,040 8,578 9,556 13,728 7,378
Step by Step Solution
There are 3 Steps involved in it

Get step-by-step solutions from verified subject matter experts