

Question: Question: Given that the standard deviation is larger then the IQR for the fish category compared to the beef and eggs food groups, what does
Question:
Given that the standard deviation is larger then the IQR for the fish category compared to the beef and eggs food groups, what does this suggest about the distribution of the consumption of fish across these 130 countries?
Options:
The beef and eggs food groups have evidence of more extreme values compared to the fish group.
The fish group is likely skewed whereas both the beef and eggs groups are likely symmetric.
The fish group has extreme values compared beef and eggs groups
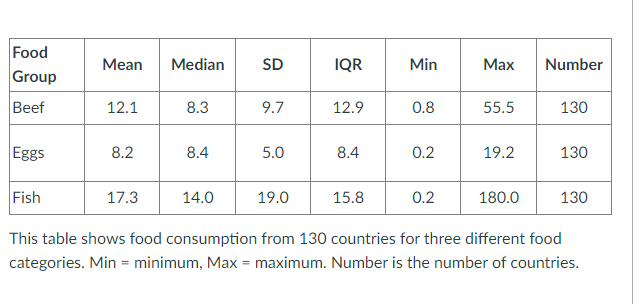
This table shows food consumption from 130 countries for three different food categories. Min = minimum, Max = maximum. Number is the number of countries
Step by Step Solution
There are 3 Steps involved in it

Get step-by-step solutions from verified subject matter experts