

Question: Question I (25 points) Table 1 is from the paper by Kim and Loungani (1992). The role of energy in real business cycle models, published
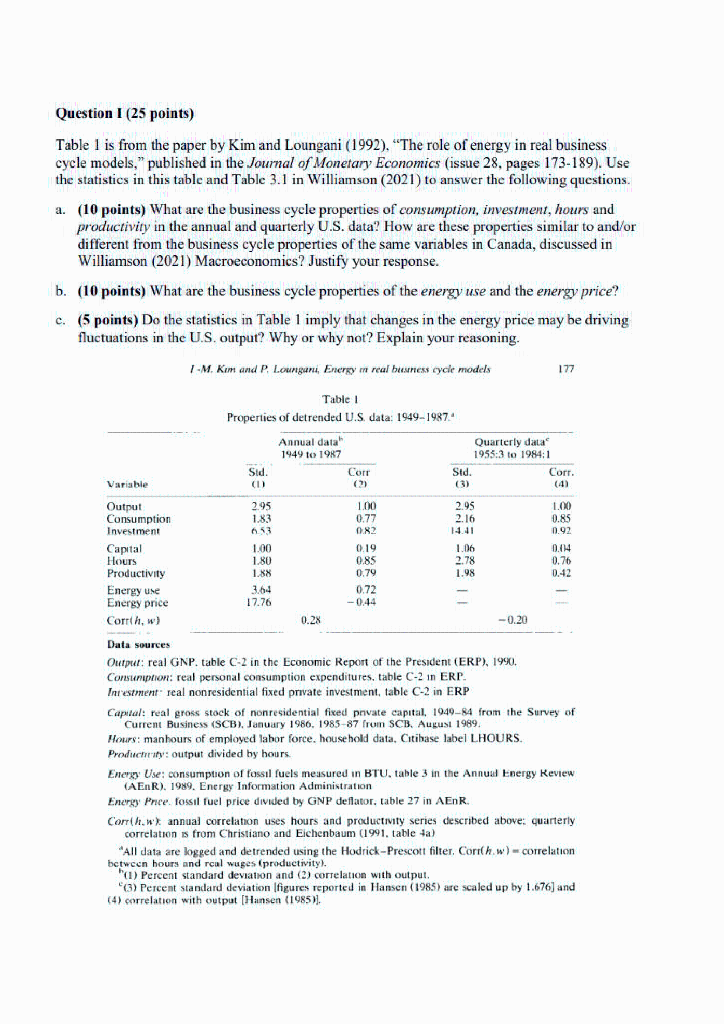
Question I (25 points) Table 1 is from the paper by Kim and Loungani (1992). "The role of energy in real business cycle models," published in the Journal of Monetary Economics (issue 28, pages 173-189). Use the statistics in this table and Table 3.1 in Williamson (2021) to answer the following questions. a. (10 points) What are the business cycle properties of consumption, investment, hours and productivity in the annual and quarterly U.S. data? How are these properties similar to and/or different from the business cycle properties of the same variables in Canada, discussed in Williamson (2021) Macroeconomics? Justify your response. b. (10 points) What are the business cycle properties of the energy use and the energy price? c. (5 points) Do the statistics in Table 1 imply that changes in the energy price may be driving fluctuations in the U.S. output? Why or why not? Explain your reasoning. 1-M. Kim and P. Loungani, Energy m real business cycle models 177 Table 1 Properties of detrended U.S data: 1949-1987. Annual data 1949 to 1987 Corr ( Quarterly data 1953:3 to 1984:1 Std. Corr. 03) (4) Sid. (1) 295 1.83 0.53 1.00 0.85 0.92 Variable Output Consumption Investment Capital Hours Productivity Energy use Energy price Corrth, w) 100 0.77 DR2 0.19 0.85 0.79 2.95 2.16 11.11 1.06 2.78 1.98 1.00 1.80 1.88 0.04 0.76 0.42 3.64 17.76 0.72 -0.44 0.28 -0.20 Data sources Output: real GNP. table C-2 in the Economic Report of the President (ERP), 1990. Consumption: real personal consumption expenditures, table C-2 in ERP. Inrestment real nonresidential fixed private investment, table C-2 in ERP Capital: real gross stock of nonresidential ficed pevate capital, 1949-84 from the Survey of Current Business (SCB), January 1986, 1985-87 from SCB. August 1989. Hours: manhours of employed labor force. house hold data. Citibase label LHOURS. Produchy: output divided by hours. Energy Use: consumption of fossil fuels measured in BTU, table 3 in the Annual Energy Review (AER). 1989. Energy Information Administration Energy Pree, fossil fuel price divided by GNP dellator, table 27 in AER. Corrih.wx annual correlation uses hours and productivity series described above: quarterly correlations from Christiano and Eichenbaum (1991, tableta) , "All data are logged and detrended using the Hodrick - Prescott filter. Corrh.w) - correlation between hours and real wuges (productivity). (1) Percent standard deviation and (2) correlation with output. (3) Percent standard deviation figures reported in Hansen (1985) are scaled up by 1.676) and (4) correlation with output (Hansen (1985). Question I (25 points) Table 1 is from the paper by Kim and Loungani (1992). "The role of energy in real business cycle models," published in the Journal of Monetary Economics (issue 28, pages 173-189). Use the statistics in this table and Table 3.1 in Williamson (2021) to answer the following questions. a. (10 points) What are the business cycle properties of consumption, investment, hours and productivity in the annual and quarterly U.S. data? How are these properties similar to and/or different from the business cycle properties of the same variables in Canada, discussed in Williamson (2021) Macroeconomics? Justify your response. b. (10 points) What are the business cycle properties of the energy use and the energy price? c. (5 points) Do the statistics in Table 1 imply that changes in the energy price may be driving fluctuations in the U.S. output? Why or why not? Explain your reasoning. 1-M. Kim and P. Loungani, Energy m real business cycle models 177 Table 1 Properties of detrended U.S data: 1949-1987. Annual data 1949 to 1987 Corr ( Quarterly data 1953:3 to 1984:1 Std. Corr. 03) (4) Sid. (1) 295 1.83 0.53 1.00 0.85 0.92 Variable Output Consumption Investment Capital Hours Productivity Energy use Energy price Corrth, w) 100 0.77 DR2 0.19 0.85 0.79 2.95 2.16 11.11 1.06 2.78 1.98 1.00 1.80 1.88 0.04 0.76 0.42 3.64 17.76 0.72 -0.44 0.28 -0.20 Data sources Output: real GNP. table C-2 in the Economic Report of the President (ERP), 1990. Consumption: real personal consumption expenditures, table C-2 in ERP. Inrestment real nonresidential fixed private investment, table C-2 in ERP Capital: real gross stock of nonresidential ficed pevate capital, 1949-84 from the Survey of Current Business (SCB), January 1986, 1985-87 from SCB. August 1989. Hours: manhours of employed labor force. house hold data. Citibase label LHOURS. Produchy: output divided by hours. Energy Use: consumption of fossil fuels measured in BTU, table 3 in the Annual Energy Review (AER). 1989. Energy Information Administration Energy Pree, fossil fuel price divided by GNP dellator, table 27 in AER. Corrih.wx annual correlation uses hours and productivity series described above: quarterly correlations from Christiano and Eichenbaum (1991, tableta) , "All data are logged and detrended using the Hodrick - Prescott filter. Corrh.w) - correlation between hours and real wuges (productivity). (1) Percent standard deviation and (2) correlation with output. (3) Percent standard deviation figures reported in Hansen (1985) are scaled up by 1.676) and (4) correlation with output (Hansen (1985)
Step by Step Solution
There are 3 Steps involved in it

Get step-by-step solutions from verified subject matter experts