

Question: Question: I need help analyzing my Optimism Research Data. Truth is ... I don't have a clue. I have entered the data in the preprogrammed
Question:
I need help analyzing my Optimism Research Data. Truth is ... I don't have a clue. I have entered the data in the preprogrammed excel sheet. Here are the instructions:?
?
?
?
iv. Look at the mean, median, mode and standard deviation and describe how these measures of central tendency indicates whether the distribution of men and women are normal or skewed. That is, is the distribution of men and women normal or skewed? How does the mean, median, and mode scores indicate if the distribution is normal or skewed??
?
?
?
v. Look at the table of raw data for both men and women. Explain why the raw numbers indicate the distribution is normal or skewed. If the distributions are normal how would the scores have to change to yield a skewed distribution? If the distributions is skewed, how would the scores have to change to yield a normal distribution.?
?
?
?
P Value and Optimism Study:?
?
?
?
a. After all your data is in you will see your p-value for your independent t-test populate. Remember this independent t-test is used to analyze if the difference between two?
?
groups is statistically significant. This test is based off of the 15 females and 15 males. This is a two-tail test and note that we are assuming normality. In your analysis you will state your null and alternative hypothesis and the decision based off of the p-value that was provided in the cell. We are testing this level at a significance of 0.05.?
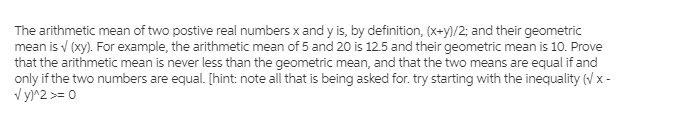


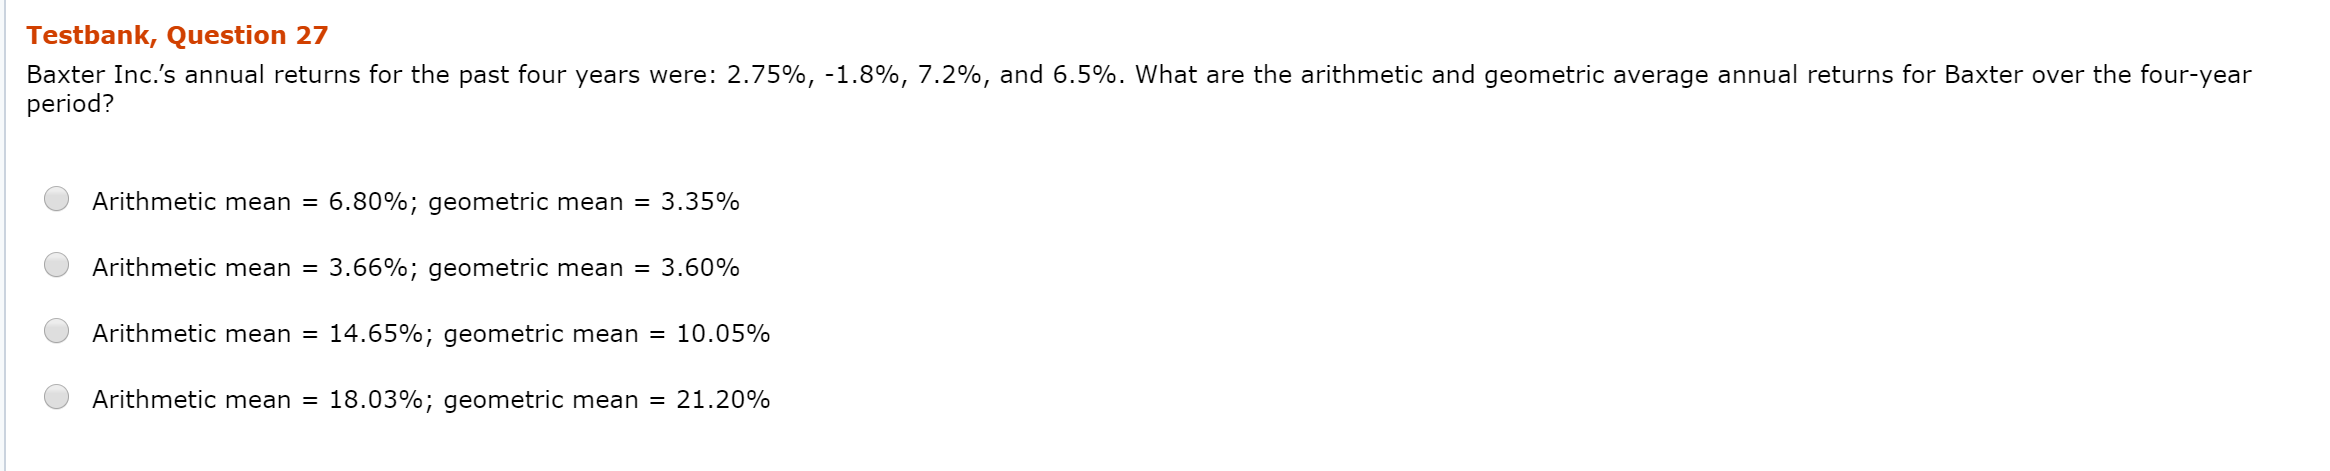
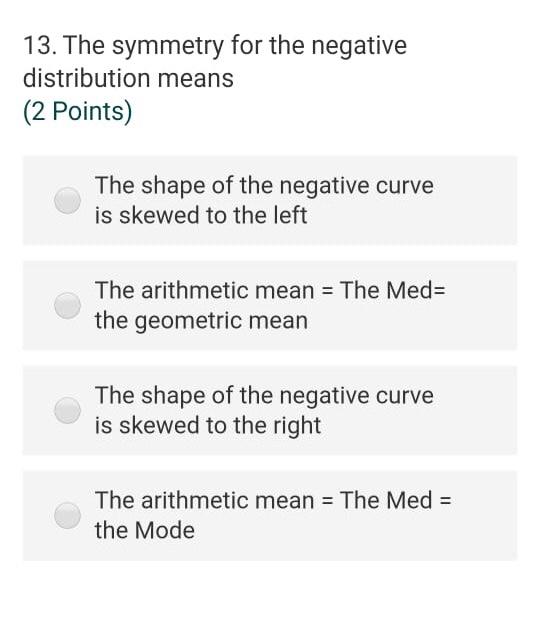
\fThe arithmetic mean of two postive real numbers x and y is, by definition, (x+y)/2; and their geometric mean is v (xy). For example, the arithmetic mean of 5 and 20 is 12.5 and their geometric mean is 10. Prove that the arithmetic mean is never less than the geometric mean, and that the two means are equal if and only if the two numbers are equal. [hint: note all that is being asked for. try starting with the inequality (v x - V y) 2 >= 0Testbank, Question 27 Baxter Inc.'s annual returns for the past four years were: 2.75%, -1.8%, 7.2%, and 6.5%. What are the arithmetic and geometric average annual returns for Baxter over the fouryear period? 0 Arithmetic mean = 6.80%; geometric mean = 3.35% O Arithmetic mean = 3.66%; geometric mean = 3.60% O Arithmetic mean 14.65%; geometric mean = 10.05% 0 Arithmetic mean 18.03%; geometric mean = 21.20% 13. The symmetry for the negative distribution means (2 Points) The shape of the negative curve is skewed to the left The arithmetic mean = The Med= the geometric mean The shape of the negative curve is skewed to the right The arithmetic mean = The Med = the Mode
Step by Step Solution
There are 3 Steps involved in it

Get step-by-step solutions from verified subject matter experts