Question: Question: Identify and explain the existing or potential weaknesses in Pampered Feet's financial and management performance, its responses to its competitive environment, and the reasons
Question: Identify and explain the existing or potential weaknesses in Pampered Feet's financial and management performance, its responses to its competitive environment, and the reasons for any improvement or deterioration in those areas.
Company Background:
Founded approximately ten years ago its current owner, Steven Gross, Pampered Feet is a retailer of upscale, comfortable, fashionable, technologically advanced, active footwear. It carries walking shoes, hiking boots, dress sandals, sport sandals, and casual shoes - all of which are comfortable and designed to "pamper customers' feet". Pampered Feet currently has two stores, one in Sydney and one in Brisbane. Steven is now looking to open a third shop on the Gold Coast. Steven gained extensive experience working for various department stores as a marketing manager, where he saw the difficulties facing footwear departments trying to compete with specialist shoe stores. He also identified a growing demand for stylish comfortable shoes. This prompted him to set up the first of his own specialist stores, offering customers a good range of footwear that was both comfortable and fashionable. The target audience for Pampered Feet are customers with high disposable income who are prepared to pay for quality shoe wear. Steven's view is that there is an excellent opportunity in this market. Pampered Feet's first store in Sydney did well. Then, five years ago, Steven opened the Brisbane store, and "things went a little crazy for the first year or two," he says. But they've settled down since then. For the three years prior to last year, sales grew by 10% or so each year. Last year, sales grew by only about 6%, because of remodelling at the strip centre where the Sydney store is located. Traffic was down for all the businesses in the area for several months. That renovation is now complete, and this year business should be back to normal. Pampered Feet banks at one of your competitors and has a $200,000 overdraft facility with that institution. The line is used to support stock needs. Purportedly due to lack of attentiveness from his current lender, Steven has approached your bank about a facility to replace his existing short-term credit facility. He also wants to increase it to $350,000 to support the business's larger needs - primarily shoe stock - related to the opening of the Gold Coast shop.
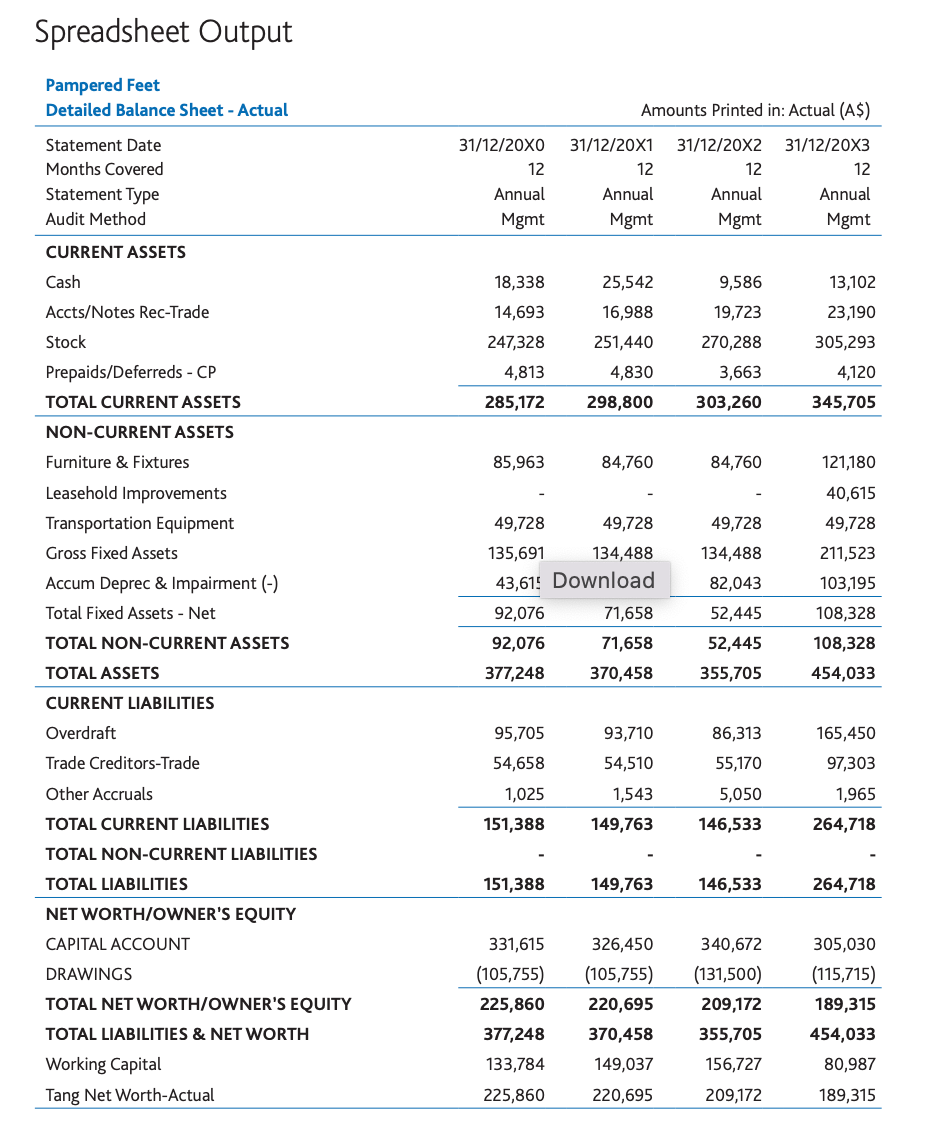
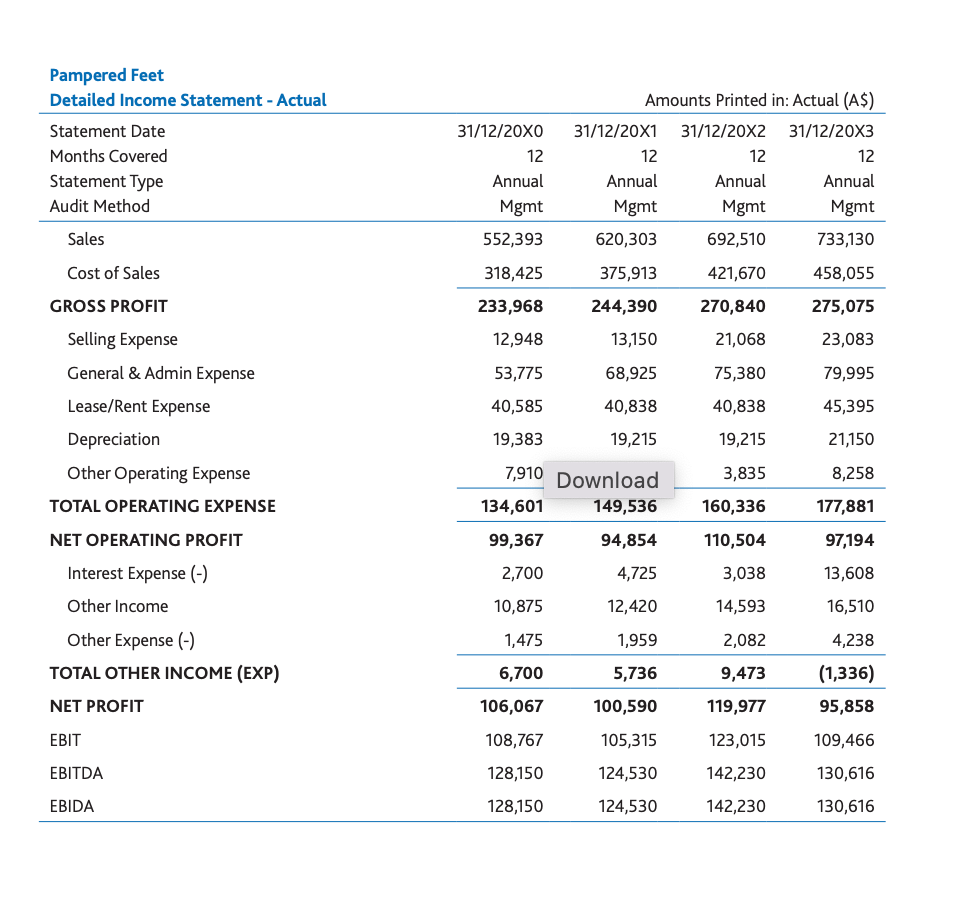
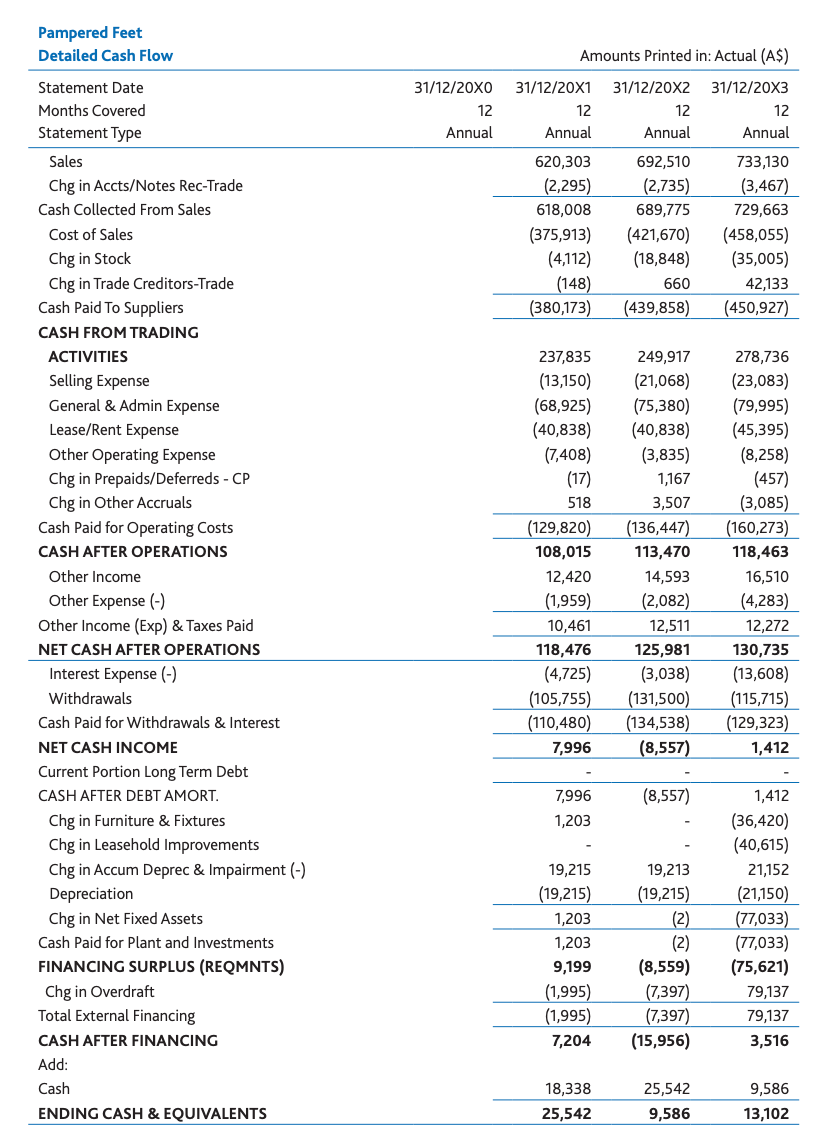
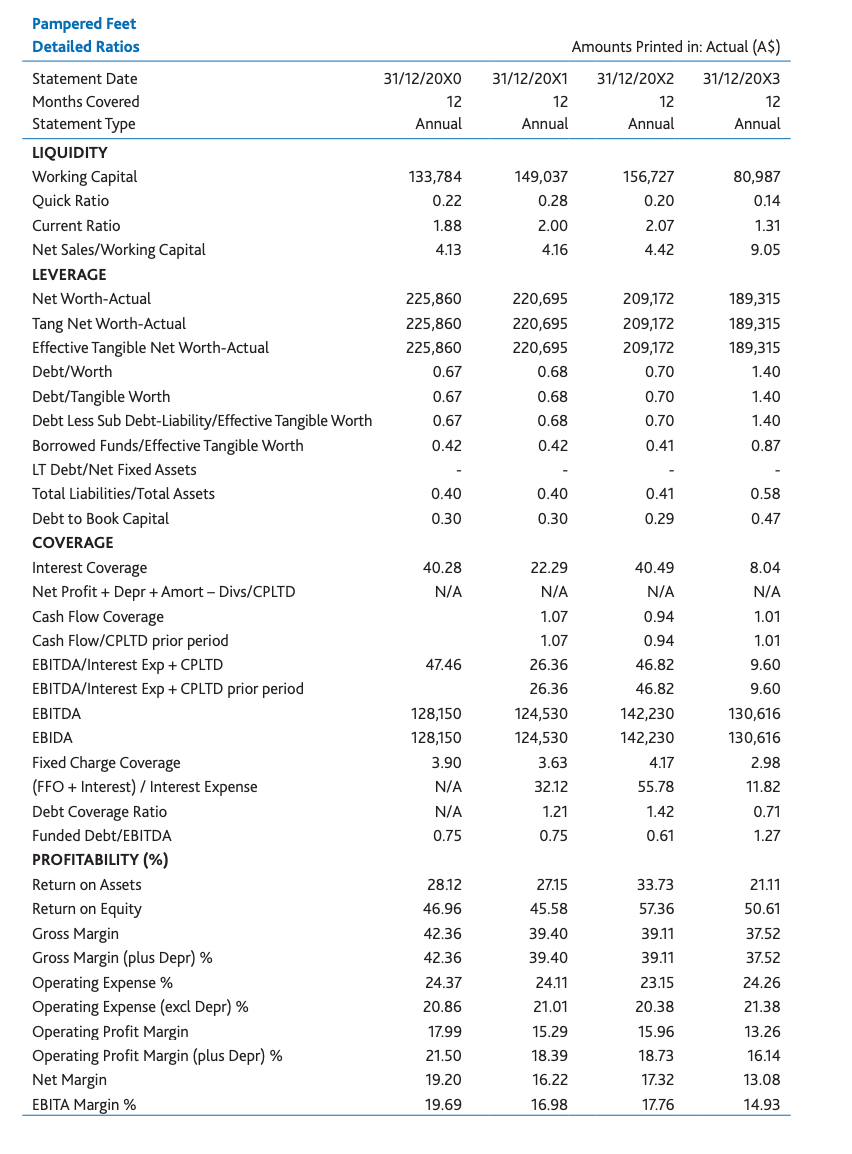
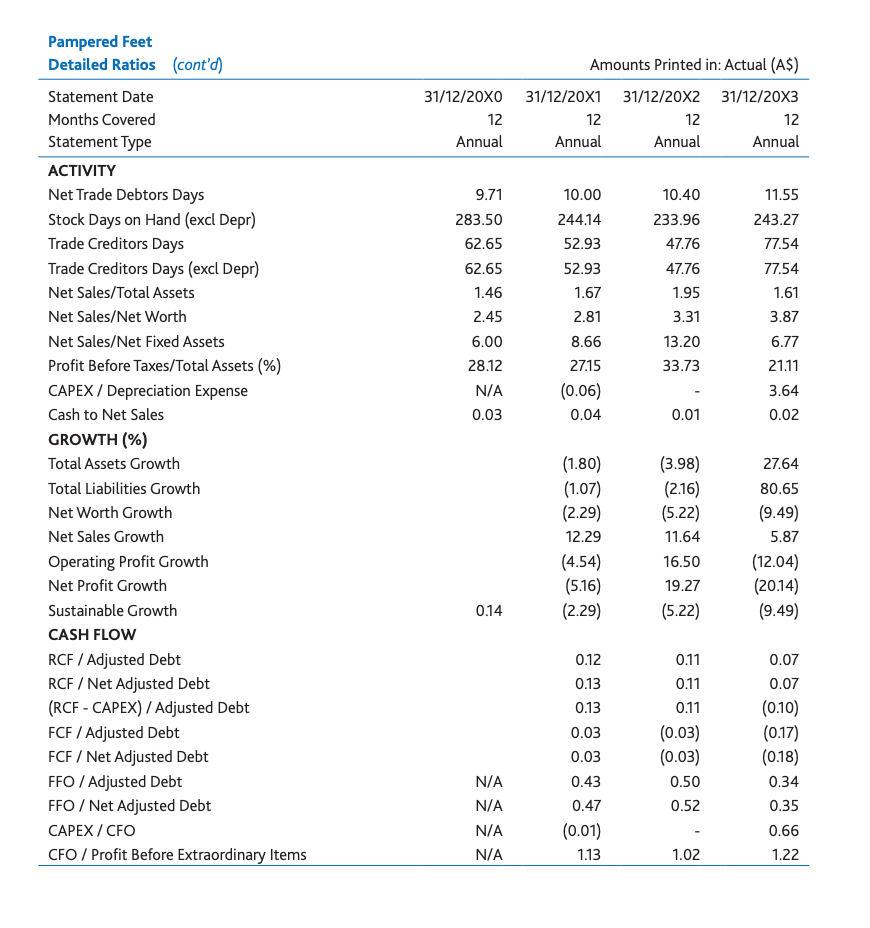
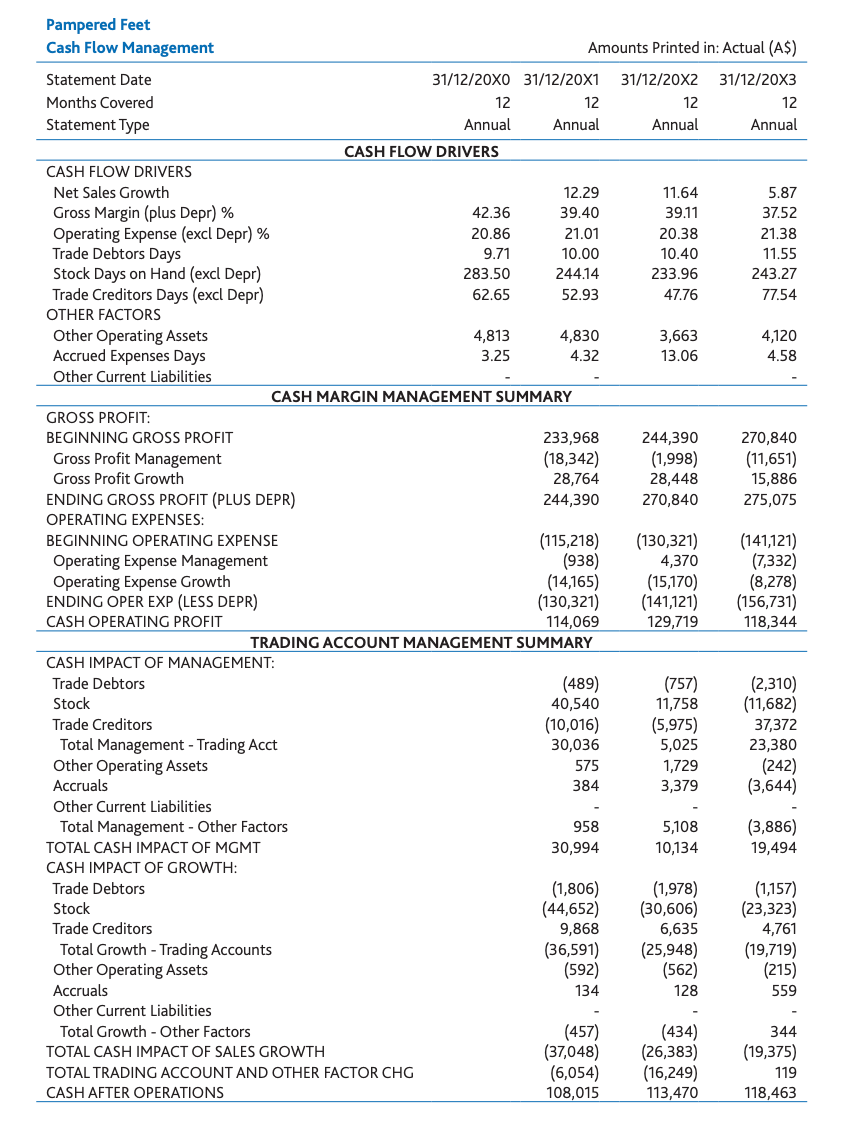
Spreadsheet Output Pampered Feet Detailed Balance Sheet - Actual Amounts Printed in: Actual (A$) Statement Date 31/12/20X0 31/12/20X1 31/12/20X2 31/12/20X3 Months Covered 12 12 12 12 Statement Type Annual Annual Annual Annual Audit Method Mgmt Mgmt Mgmt Memt CURRENT ASSETS Cash 18,338 25,542 9,586 13,102 Accts/Notes Rec-Trade 14,693 16,988 19,723 23,190 Stock 247,328 251,440 270,288 305,293 Prepaids/Deferreds - CP 4,813 4,830 3,663 4,120 TOTAL CURRENT ASSETS 285,172 298,800 303,260 345,705 NON-CURRENT ASSETS Furniture & Fixtures 85,963 84,760 84,760 121,180 Leasehold Improvements 40,615 Transportation Equipment 49,728 49,728 49,728 49,728 Gross Fixed Assets 135,691 134,488 134,488 211,523 Accum Deprec & Impairment (-) 43,61: Download 82,043 103,195 Total Fixed Assets - Net 92,076 71,658 52,445 108,328 TOTAL NON-CURRENT ASSETS 92,076 71,658 52,445 108,328 TOTAL ASSETS 377,248 370,458 355,705 454,033 CURRENT LIABILITIES Overdraft 95,705 93,710 86,313 165,450 Trade Creditors-Trade 54,658 54,510 55,170 97,303 Other Accruals 1,025 1,543 5,050 1,965 TOTAL CURRENT LIABILITIES 151,388 149,763 146,533 264,718 TOTAL NON-CURRENT LIABILITIES TOTAL LIABILITIES 151,388 149,763 146,533 264,718 NET WORTH/OWNER'S EQUITY CAPITAL ACCOUNT 331,615 326,450 340,672 305,030 DRAWINGS (105,755) (105,755) (131,500) (715,715) TOTAL NET WORTH/OWNER'S EQUITY 225,860 220,695 209,172 189,315 TOTAL LIABILITIES & NET WORTH 377,248 370,458 355,705 454,033 Working Capital 133,784 149,037 156,727 80,987 Tang Net Worth-Actual 225,860 220,695 209,172 189,315Pampered Feet Detailed Income Statement - Actual Amounts Printed in: Actual (A$) Statement Date 31/12/20X0 3112/20X1 3112/20X2 31/12/20X3 Months Covered 12 12 12 12 Statement Type Annual Annual Annual Annual Audit Method Mgmt Mgmt Mgmt Mgmt Sales 552,393 620,303 692,510 733130 Cost of Sales 318,425 375,913 421,670 458,055 GROSS PROFIT 233,968 244,390 270,840 275,075 Selling Expense 12,948 13,150 21,068 23,083 General & Admin Expense 53,775 68,925 75,380 79,995 Lease/Rent Expense 40,585 40,838 40,838 45,395 Depreciation 19,383 19,215 19,215 21,150 Other Operating Expense 7,910 Download 3,835 8,258 TOTAL OPERATING EXPENSE 134,601 149,536 160,336 177,881 NET OPERATING PROFIT 99,367 94,854 110,504 97,194 Interest Expense (-) 2,700 4,725 3,038 13,608 Other Income 10,875 12,420 14,593 16,510 Other Expense (-) 1,475 1,959 2,082 4,238 TOTAL OTHER INCOME (EXP) 6,700 5,736 9,473 (1,336) NET PROFIT 106,067 100,590 119,977 95,858 EBIT 108,767 105,315 123,015 109,466 EBITDA 128,150 124,530 142,230 130,616 EBIDA 128,150 124,530 142,230 130,616 Pampered Feet Detailed Cash Flow Amounts Printed in: Actual (A$) Statement Date 31/12/20X0 31/12/20X1 31/12/20X2 31/12/20X3 Months Covered 12 12 12 12 Statement Type Annual Annual Annual Annual Sales 620,303 692,510 733,130 Chg in Accts/Notes Rec-Trade (2,295) (2,735) (3,467) Cash Collected From Sales 618,008 689,775 729,663 Cost of Sales (375913) (421670) (458,055) Chg in Stock (4112) (18,848) (35,005) Chg in Trade Creditors-Trade (148) 660 42,133 Cash Paid To Suppliers (3807173) (439,858) (450,927) CASH FROMTRADING ACTIVITIES 237,835 249,917 278,736 Selling Expense (13)150) (21,068) (23,083) General & Admin Expense (68,925) (75,380) (79,995) Lease/Rent Expense (40,838) (40,838) (45,395) Other Operating Expense (7,408) (3,835) (8,258) Chg in Prepaids/Deferreds - CP (17) 1,167 (457) Chg in Other Accruals 518 3,507 (3,085) Cash Paid for Operating Costs (129,820) (136,447) (160,273) CASH AFTER OPERATIONS 108,015 113,470 118,463 Other Income 12,420 14,593 16,510 Other Expense (-) (1,959) (2,082) (4,283) Other Income (Exp) & Taxes Paid 10,461 12,51 12,272 NET CASH AFTER OPERATIONS 118,476 125,981 130,735 Interest Expense (-) (4,725) (3,038) (13,608) Withdrawals (105,755 (131,500) (115,715) Cash Paid for Withdrawals & Interest (110,480) (134,538) (129,323) NET CASH INCOME 7,996 (8,557) 1,412 Current Portion Long Term Debt - - - CASH AFTER DEBT AMORT. 7996 (8,557) 1.412 Chg in Furniture & Fixtures 1,203 - (36,420) Chg in Leasehold Improvements - - (40,615) Chg in Accum Deprec & Impairment (-) 19,215 19,213 21,152 Depreciation (19,215) (19,215) (21150) Chg in Net Fixed Assets . 1,203 (2) (77,033) Cash Paid for Plant and Investments 1,203 (2) (77,033) FINANCING SURPLUS (REQMNTS) 9,199 (8,559) (75,621) Chg in Overdraft (1,995) (7.397) 79137 Total External Financing (1,995) (7397) 79,137 CASH AFTER FINANCING 7,204 (15,956) 3,516 Add: Cash 18,338 25,542 9,586 ENDING CASH & EQUIVALENTS 25,542 9,586 13,102 Pampered Feet Detailed Ratios Amounts Printed in: Actual (A$) Statement Date 31/12/20X0 31/12/20X1 31/12/20X2 31/12/20X3 Months Covered 12 12 12 12 Statement Type Annual Annual Annual Annual LIQUIDITY Working Capital 133,784 149,037 156,727 80,987 Quick Ratio 0.22 0.28 0.20 0.14 Current Ratio 1.88 2.00 2.07 1.31 Net Sales/Working Capital 4.13 4.16 4.42 9.05 LEVERAGE Net Worth-Actual 225,860 220,695 209,172 189,315 Tang Net Worth-Actual 225,860 220,695 209,172 189,315 Effective Tangible Net Worth-Actual 225,860 220,695 209,172 189,315 Debt/Worth 0.67 0.68 0.70 1.40 Debt/Tangible Worth 0.67 0.68 0.70 1.40 Debt Less Sub Debt-Liability/Effective Tangible Worth 0.67 0.68 0.70 1.40 Borrowed Funds/Effective Tangible Worth 0.42 0.42 0.41 0.87 LT Debt/Net Fixed Assets Total Liabilities/Total Assets 0.40 0.40 0.41 0.58 Debt to Book Capital 0.30 0.30 0.29 0.47 COVERAGE Interest Coverage 40.28 22.29 40.49 8.04 Net Profit + Depr + Amort - Divs/CPLTD N/A N/A N/A N/A Cash Flow Coverage 1.07 0.94 1.01 Cash Flow/CPLTD prior period 1.07 0.94 1.01 EBITDA/Interest Exp + CPLTD 47.46 26.36 46.82 9.60 EBITDA/Interest Exp + CPLTD prior period 26.36 46.82 9.60 EBITDA 128,150 124,530 142,230 130,616 EBIDA 128,150 124,530 142,230 130,616 Fixed Charge Coverage 3.90 3.63 4.17 2.98 (FFO + Interest) / Interest Expense N/A 32.12 55.78 11.82 Debt Coverage Ratio N/A 1.21 1.42 0.71 Funded Debt/EBITDA 0.75 0.75 0.61 1.27 PROFITABILITY (%) Return on Assets 28.12 27.15 33.73 21.11 Return on Equity 46.96 45.58 57.36 50.61 Gross Margin 42.36 39.40 39.11 37.52 Gross Margin (plus Depr) % 42.36 39.40 39.11 37.52 Operating Expense % 24.37 24.11 23.15 24.26 Operating Expense (excl Depr) % 20.86 21.01 20.38 21.38 Operating Profit Margin 17.99 15.29 15.96 13.26 Operating Profit Margin (plus Depr) % 21.50 18.39 18.73 16.14 Net Margin 19.20 16.22 17.32 13.08 EBITA Margin % 19.69 16.98 17.76 14.93Pampered Feet Detailed Ratios (cont'd) Amounts Printed in: Actual (A$) Statement Date 31/12/20X0 31/12/20X1 31/12/20X2 31/12/20X3 Months Covered 12 12 12 12 Statement Type Annual Annual Annual Annual ACTIVITY Net Trade Debtors Days 9.71 10.00 10.40 11.55 Stock Days on Hand (excl Depr) 283.50 244.14 233.96 243.27 Trade Creditors Days 62.65 52.93 47.76 77.54 Trade Creditors Days (excl Depr) 62.65 52.93 47.76 77.54 Net Sales/Total Assets 1.46 1.67 1.95 1.61 Net Sales/Net Worth 2.45 2.81 3.31 3.87 Net Sales/Net Fixed Assets 6.00 8.66 13.20 6.77 Profit Before Taxes/Total Assets (%) 28.12 27.15 33.73 21.11 CAPEX / Depreciation Expense N/A (0.06) 3.64 Cash to Net Sales 0.03 0.04 0.01 0.02 GROWTH (%) Total Assets Growth (1.80) (3.98) 27.64 Total Liabilities Growth (1.07) (2.16) 80.65 Net Worth Growth (2.29) (5.22) (9.49) Net Sales Growth 12.29 11.64 5.87 Operating Profit Growth (4.54) 16.50 (12.04) Net Profit Growth (5.16) 19.27 (20.14) Sustainable Growth 0.14 (2.29) (5.22) (9.49) CASH FLOW RCF / Adjusted Debt 0.12 0.11 0.07 RCF / Net Adjusted Debt 0.13 0.11 0.07 (RCF - CAPEX) / Adjusted Debt 0.13 0.11 (0.10) FCF / Adjusted Debt 0.03 (0.03) (0.17) FCF / Net Adjusted Debt 0.03 (0.03) (0.18) FFO / Adjusted Debt N/A 0.43 0.50 0.34 FFO / Net Adjusted Debt N/A 0.47 0.52 0.35 CAPEX / CFO N/A (0.01) 0.66 CFO / Profit Before Extraordinary Items N/A 1.13 1.02 1.22Pampered Feet Cash Flow Management Amounts Printed in: Actual (A%) Statement Date 31/12/20X0 31/12/20X1 31/12/20X2 31/12/20X3 Months Covered 12 12 12 12 Statement Type Annual Annual Annual Annual CASH FLOW DRIVERS CASH FLOW DRIVERS Net Sales Growth 12.29 1.64 5.87 Gross Margin (plus Depr) % 4236 39.40 391 37.52 Operating Expense (excl Depr) % 20.86 21.01 20.38 2138 Trade Debtors Days 9.71 10.00 10.40 11.55 Stock Days on Hand (excl Depr) 283.50 24414 23396 243.27 Trade Creditors Days (excl Depr) 62.65 52.93 4776 77.54 OTHER FACTORS Other Operating Assets 4,813 4,830 3,663 4120 Accrued Expenses Days 3.25 4.32 13.06 4.58 Other Current Liabilities - - - CASH MARGIN MANAGEMENT SUMMARY GROSS PROFIT: BEGINNING GROSS PROFIT 233,968 244,390 270,840 Gross Profit Management (18,342) (1,998) (11,651) Gross Profit Growth 28,764 28,448 15,886 ENDING GROSS PROFIT (PLUS DEPR) 244,390 270,840 275,075 OPERATING EXPENSES: BEGINNING OPERATING EXPEMNSE (115,218) (130,3217) (141,127) Operating Expense Management (938) 4,370 (7,332) Operating Expense Growth (14,165) (15170) (8,278) ENDING OPER EXP (LESS DEPR) (130,321) (141121) (156,731) CASH OPERATING PROFIT 114,069 129,719 118,344 TRADING ACCOUNT MANAGEMENT SUMMARY CASH IMPACT OF MANAGEMENT: Trade Debtors (489) (757) (2,310) Stock 40,540 1,758 (11,682) Trade Creditors (10,016) (5,975) 37372 Total Management - Trading Acct 30,036 5,025 23,380 Other Operating Assets 575 1,729 (242) Accruals 384 3,379 (3,644) Other Current Liabilities - - - Total Management - Other Factors 958 5108 (3,886) TOTAL CASH IMPACT OF MGMT 30,994 10134 19,494 CASH IMPACT OF GROWTH: Trade Debtors (1,8086) (1,978) (1157) Stock (44,652) (30,606) (23,323) Trade Creditors 9,868 6,635 4,761 Total Growth - Trading Accounts (36,591) (25,948) (19,719) Other Operating Assets (592) (562) (215) Accruals 134 128 559 Other Current Liabilities - - - Total Growth - Other Factors (457) (434) 344 TOTAL CASH IMPACT OF SALES GROWTH (37,048) (26,383) (19,375) TOTALTRADING ACCOUNT AND OTHER FACTOR CHG (6,054) (16,249) 19 CASH AFTER OPERATIONS 108,015 113,470 118,463
Step by Step Solution
There are 3 Steps involved in it
1 Expert Approved Answer
Step: 1 Unlock
Question Has Been Solved by an Expert!
Get step-by-step solutions from verified subject matter experts
Step: 2 Unlock
Step: 3 Unlock
Students Have Also Explored These Related Accounting Questions!