Question: Question : If you were asked to suggest an appropriate global strategy for B&Js at the end of the case, which 3-4 key factors could
Question: If you were asked to suggest an appropriate global strategy for B&Js at the end of the case, which 3-4 key factors could you identify in detail that would influence B&Js ideal global strategic position in the Global Integration Local Responsiveness grid? Draw a grid and place B&Js in its ideal position given your assessment of the relative strength of Global Integration Local Responsiveness factors operating on the company.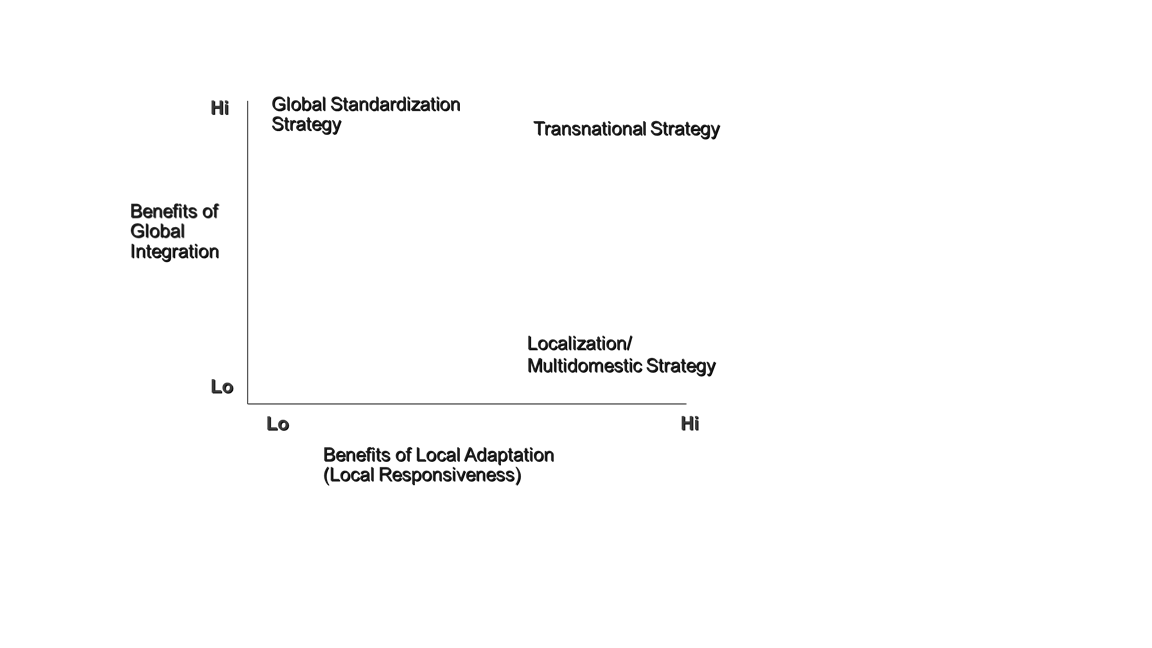
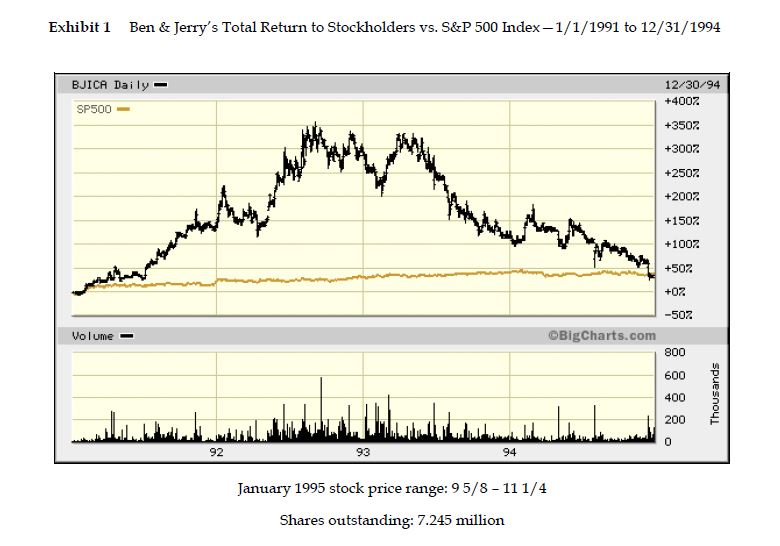
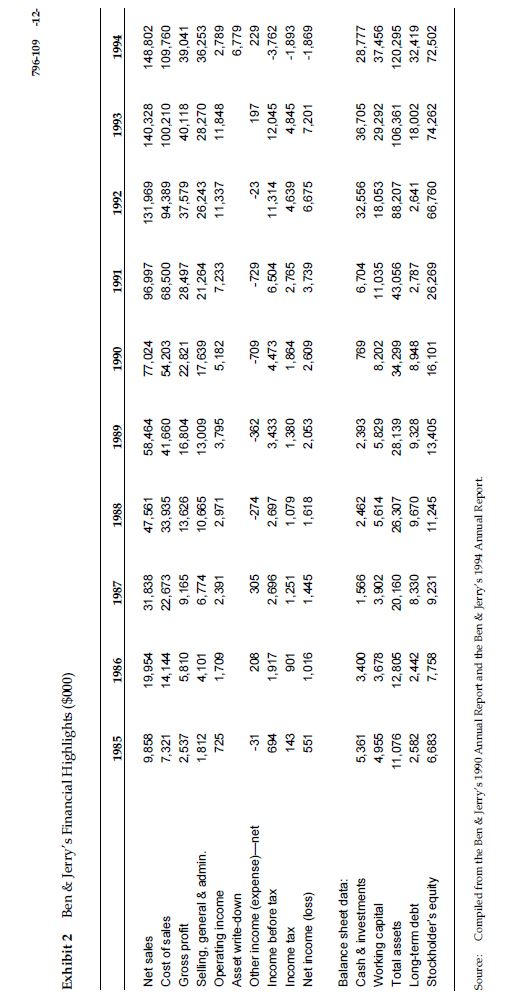
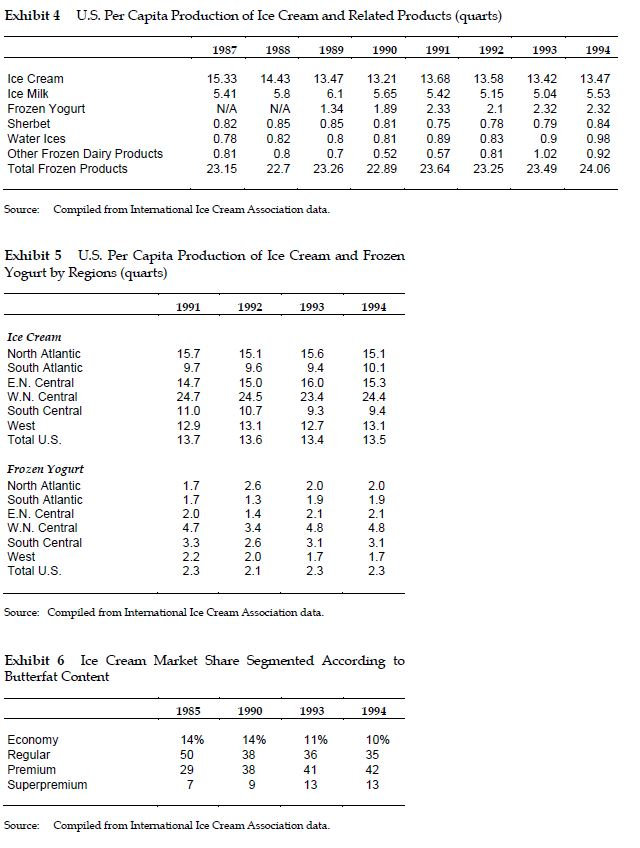
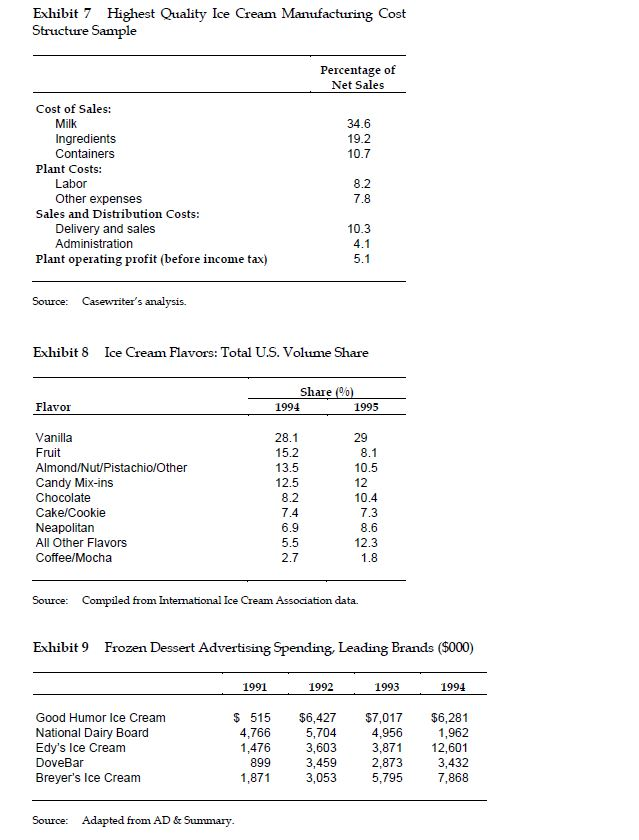
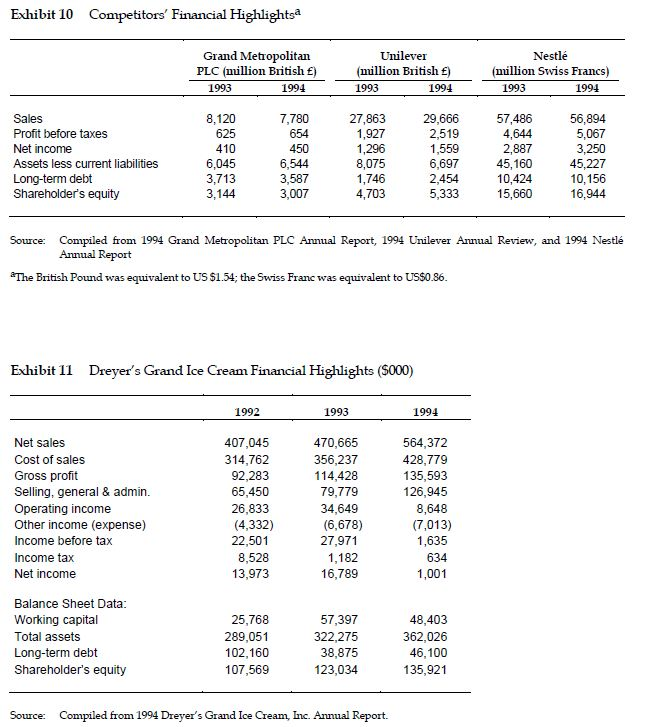
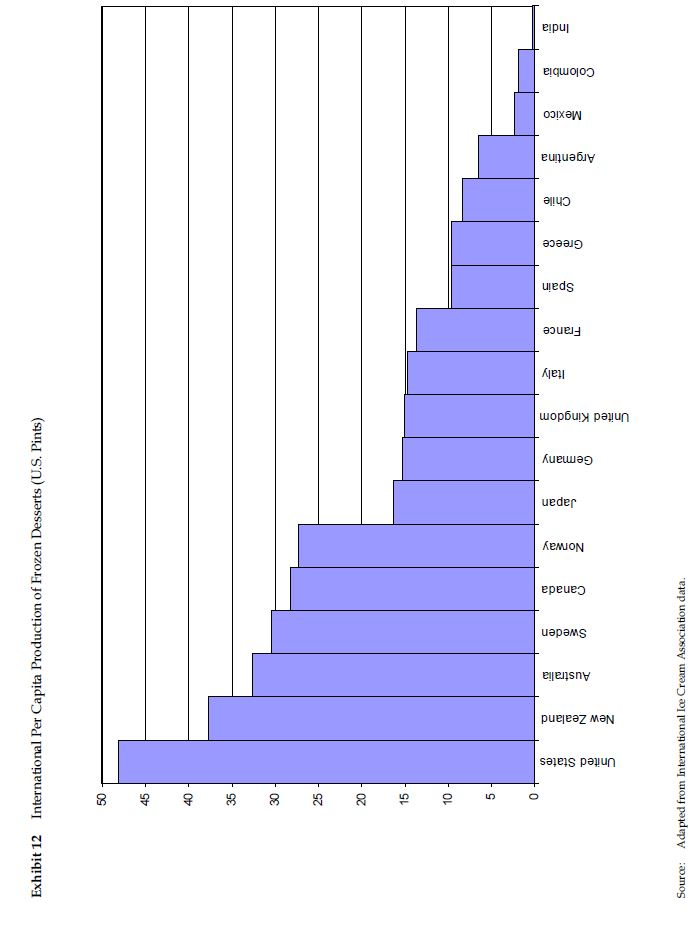
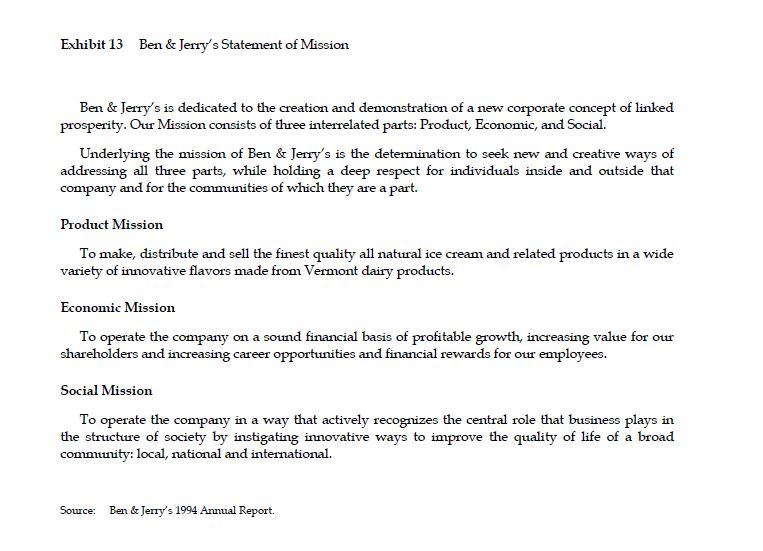
Hi Global Standardization Strategy Transnational Strategy Benefits of Global Integration Localization/ Multidomestic Strategy Benefits of Local Adaptation (Local Responsiveness) Ben & Jerry's Homemade Ice Cream Inc.: A Period of Transition In February 1995, Bob Holland was named CEO of Ben & Jerry's and took over day-to-day leadership of the company from founder Ben Cohen. Ben & Jerry's had grown during the 1980s from an unconventional ice cream shop in a converted gas station into a formidable medium-sized company with annual sales of roughly $150 million. However, competition in the industry was beginning to rise, just as growth in the "superpremium" segment of the ice cream market - Ben & Jerry's mainstay-was beginning to slow down. In fact, Ben & Jerry's had just reported the first quarterly loss in its history. Holland was a new breed of manager for this iconoclastic company, which had become famous for its commitment to social causes and "collective management." Armed with an MBA, a background in consulting for McKinsey and Company, and with recent experience in running a plastic injection-molding company, Holland was not a typical Ben & Jerry's employee. Company History In 1963, Ben Cohen and Jerry Greenfield became friends at their Long Island, New York, high school. Fourteen years later, dissatisfied with their respective careers, they decided to start a food company together. They first moved to Vermont, resolving to live in a rural area more consistent with the "counterculture" values they had shared since the 1960s. After an initial attempt at starting a bagel delivery service, they enrolled in a $5 correspondence course on ice cream making from Penn State University. They incorporated their company on December 16, 1977. Four months later, the first Ben & Jerry's homemade ice cream shop opened for business in an old gas station in Burlington, Vermont, with an investment of $12,000 The shop was an immediate success. By 1980, low wintertime demand at the shop led Ben and Jerry to package their ice cream pint containers, which they sold through small retail outlets in the area. In 1981, sales had risen enough to require expansion of manufacturing into a second building. During the 1980s, the company was able to sell as much ice cream as it could make. As a maker of superpremium ice cream, Ben & Jerry's gained a reputation for the inconventional "mix-in" flavors, such as Cherry Garcia and Chunky Monkey. The company's growth consistently averaged over 60% annually and came mainly from entering new geographic markets with pint-sized containers. By 1990, the company was selling its products in all major markets in the United States, and was present in most of the supermarket chains and "mom and pop" stores, which accounted for the majority of ice cream sold in this country. However, in the 1990s, a trend toward healthier eating was beginning to hurt the ice cream market in general and the superpremium segment in particular. As Ben & Jerry's growth slowed, its stock price suffered. (See Exhibit 1.) In June 1994, Ben Cohen announced his resignation as CEO: Because we are no longer an upstart, we suffer from not having a CEO who has been where we need to go. We have never had an experienced CEO, and we have reached a point in our life where we need one. This is a great opportunity for someone who cares about people, has the skills and vision to see around the comers of our future business development, and always wanted to wear jeans to work. Jerry Greenfield, then vice chairman of the board, said in an interview with the New York Times: We are not giving up the baby, but this is necessary. We have 600 employees. We manufacture ice cream on two shifts and three different sites, and the level of complexity is such that it requires organizational, operational, and management expertise that goes beyond what Ben and I can offer. In terms of creating an evolving vision for the company, instilling values, pushing the boundaries of what our company can do, Ben and I have an incredible amount to offer. In terms of day-to-day management, we are lost.2 To find Ben's replacement, the company announced that it was holding a contest entitled, "Yo, I'm your CEO," in which it called for people to write to the company and state in 100 words or less why they should be chosen as the next CEO. The company received 22,000 entries, not to mention a good deal of free publicity. However, sales growth continued to slow and, in December 1994, the company announced its first quarterly loss. (See Exhibit 2.) In February 1995, after being recruited by an executive search firm, Holland assitmed the position of CEO. (See Exhibit 3.) The Ice Cream Industry The total retail value of ice cream and all related products sold in the United States was roughly $10.5 billion in 1994.3 Of the 1.5 billion gallons of frozen desserts produced in the United States in 1994, 25% was sold in bulk servings at retail shops, 25% was in the form of novelty items (frozen desserts on sticks, etc.), and the remaining 50% was packaged for home consumption. Although the mix of products had changed significantly over time, per capita consumption of ice cream and related products in 1994 reached an all-time high of 24.1 quarts. (See Exhibits 4 and 5) Ninety-eight percent of all households ate ice cream, and consumption was highest among families with young children and persons over 45 years old. Research showed that adults considered ice cream a treat or indulgence for themselves, while they served it as a reward to children. Nor was ice cream a strictly seasonal product, as the summer months accounted for only about 30% of annual consumption. Supermarket ice cream inventories turned 35 times per year, and the product generated five times more profit-per-square-foot than the average for all supermarket goods. The ice cream market was segmented into categories according to butterfat content, which ranged from as high as 17% for some superpremium brands, to less than 5% for frozen yogurt. The superpremium segment accounted for 13% of the total market in 1994. (See Exhibit 6.) Virtually all superpremium ice cream was sold by the pint, in round containers. Other categories were typically sold in half-gallon boxes. The ice cream industry was fragmented into a host of local and regional companies, alongside a growing number of large multinationals. The production process required almost six hours from start to finish. It involved pasteurizing (heating), homogenizing (pressurizing), freezing, aerating mixing filling, and finally, hardening. Of course, the highest quality products cost the most to produce. (See Exhibit 7.) Ben & Jerry's mix-in flavors were especially costly and difficult to produce given their numerous and large chunks of added ingredients. The Superpremium Ice Cream Market Superpremium ice cream was distinguished from other ice creams both by its higher fat content and by its lower level of "overrun" - the amount of air contained in the ice cream. As a result, superpremiums tasted much richer and creamier than traditional ice creams. Thus, competition in the superpremium segment focused on product quality, flavor differentiation, and marketing, rather than price. In the 1980s, a number of companies began to capitalize on market research which indicated that ice cream consumers valued quality over price. Once a consumer had decided to "invest" in a superpremium ice cream-at twice the price-per-ounce of "premium" ice creams and three or four times the price of regular ice creams-a five or ten cent-per-pint differential was not much of a factor in the choice of which superpremium brand to buy. Based on this information, major packaged food companies such as Kraft (Frusen Gladje), and Pillsbuy (Hagen-Dazs) flooded the market with superpremium products. At the same time, several small companies briefly flourished and then stumbled (Steve's Homemade Ice Cream) or perished altogether (Shamitoff Foods). Product prices and quality trended upward as consumers came to view ice cream as an affordable luxuuy good. This attitude allowed premium and superpremium ice cream volumes to grow at a 14% annual rate during the 1980s, about seven times as fast as the average consumer product. The superpremium ice cream market was separated into two relatively distinct sub-segments: traditional "smooth" flavors such as vanilla, chocolate, coffee, and chocolate chip; and "mix-in" flavors which consisted of a base ice cream of vanilla or chocolate to which large chunks of candy bars, cookies, nuts, fruit, etc. were added. (See Exhibit 8.) The cost of mix-in flavors could be as much as one-third more than smooth flavors, and yet the selling prices were the same for all flavors. During the 1980s and 1990s, Hagen-Dazs dominated the smooth sub-segment, while Ben & Jerry's was all- but synonymous with mix-ins. Ice cream consumers tended to be loyal to particular flavors as well as brands. They typically arrived at the store with a favorite flavor in mind, so producers had a strong incentive to keep as many of their flavors on the shelves as possible. They could also reduce the risk of losing customers by continually introducing new flavors. Due to the importance of product quality, flavor selection, and shelf space in gaining share of the superpremium ice cream market, product distribution became a major focus for participants in this market. The preferred method of distribution was "direct store delivery," whereby ice cream was delivered to stores and actually placed on the shelf by a distributor representative. The use of direct store delivery meant that distribution costs were an important competitive factor in the ice cream industry, particularly in the lower-priced segments. By the early 1990s, lower-fat desserts became increasingly popular among American consumers, due at least in part to the country's aging population. The U.S. Food and Drug Administration reinforced this trend in 1994 by mandating a new food labeling standard. Manufacturers were now required to clearly list ingredients and nutritional information on all goods packaging, including fat content. As manufacturers rushed to meet the new demand for low fat, "reduced guilt" products, the ice cream market quickly fragmented into hundreds of flavors and a half-dozen gradations of fat, from superpremium to fat-free frozen desserts with no sugar. Output in 1995 continued to reflect a rapidly expanding market for reduced-fat frozen dessert products, including new lines of sorbets and sherbets, for example. From 1993 to 1994, water ices and sherbet growth rates increased to 9.9% and 7.8% respectively. Particularly dramatic was the demand for frozen yogurt, which by 1993 had captured 17% of the superpremium frozen dessert market, up 21% from the pervious year. By the mid-1990s, competition in the ice cream industry had become extremely intense and difficult. Market penetration by leading brands had been achieved in all significant markets across the United States. Shelf space was tight, as retailers struggled to make room for the increasingly popular frozen yogurts, ice milks, and nonfat ice creams. Also, with consumers more value conscious than in the 1980s, purchases began to shift from the superpremium to the less expensive premium segment. Growth of the superpremium segment had slowed dramatically by 1994 to a rate of around 4%, while the premium segment was up to 11% annual growth. Until this time, the ice cream industry as a whole had traditionally spent little on advertising. In 1993, for example, the ice cream industry spent just $25 million. The industry spent over $32 million by 1994, a 31% increase in advertising expenditures. (See Exhibit 9.) The Competition Hagen-Dazs Established in New Jersey in 1970, Hagen-Dazs was the oldest and largest brand in the superpremium ice cream segment, with a market share just below 50%. Known for its elegantly designed pint containers and fine ingredients, Hagen-Dazs was owned by the U.S. food company Pillsbuy Inc., which was a subsidiary of the international conglomerate Grand Metropolitan PLC. (See Exhibit 10.) Unlike its competitors which tended to use outside distributors, Hagen-Dazs distributed roughly 50% of its product directly. In 1992, with its market leadership threatened, Hagen-Dazs began aggressively attacking Ben & Jerry's in a fight for market share. The company began to use advertising and discounting to a much greater degree than it had in the past. It offered half-price sales in certain key markets in the summer of 1993. Hagen-Dazs also developed new products, including its own version of mix-in ice cream named "Extraas." This project was only modestly successful, as it appeared that the "Extraas" flavors cannibalized Hagen-Dazs's existing line of smooth ice creams, while Ben & Jerry's mix-ins had continued to flourish. By 1993, Hagen-Dazs's new frozen yogurt line did manage a 14% market share with sales of $26.5 million. It also introduced a popular new fat-free sorbet line. Hagen-Dazs's most recent innovation was a new line of liqueur-flavored ice creams, launched in late 1994 in the United States and Europe. "Cordials" was the result of a joint venture with another Grand Metropolitan subsidiary, International Distiller and Vintners. Cordials featured unique flavors such as "Bailey's Original Irish Cream" and "Di Saronno Amaretto." The new line was predicted to be of great appeal to the characteristically indulgent superpremium ice cream consumer. Hagen-Dazs also developed a formidable presence in the overseas markets. The company entered the United Kingdom in 1990, capturing 32% of the 108 million grocery ice cream market by 1993. Growth in Britain was projected to continue at 19% per year. In 1994, the company also opened a plant in France to supply the European market. With 105 retail shops and a growing presence in Western Europe, Hagen-Dazs was also seeking new opportunities in the Mediterranean. 10 Dreyer's Grand While it was not yet present in the superpremium segment, another key competitor in the market was Dreyer's Grand Ice Cream, a California-based company. Its entry in the premium segment, called Dreyer's in the western U.S. and Edy's in the east, had experienced impressive growth, thanks to the company's extensive distribution network. Also key to the success of Dreyer's Grand was its manufacturing of other firms' products, which helped to defray the fixed costs of its own products while providing as much as one-third of Dreyer's total revenues. By 1994, it was a strong force in the market with an 11% share of the premium market, three factories, and sales of $564 million.12 In late 1993, Dreyer's launched an ambitious five-year strategic and marketing plan aimed at increasing its distribution capabilities and expanding into new markets. It had begun exporting to Asia as well as Panama-its first venture into South America. But the company's main concern was expanding its sales and distribution in the United States.13 As expected, Dreyer's marketing expenses rose substantially as the company worked to fulfill its growth plan. In 1994, Dreyer's posted net earnings of $1 million on sales of $564 million, compared with earnings of $17 million on sales of $470 million in 1993. In June 1994, Nestle, one of the two largest multinationals in the ice cream market worldwide, purchased 22% of Dreyer's Grand. (See Exhibits 10 & 11.) The company was now poised for still more growth, in spite of its recent losses. Dreyer's planned to increase the amount of spending on advertising and promotions from approximately $12 million in 1993 to 540 million-$50 million annually from 1994 through 1998.14 Breyer's Dreyer's main competitor in the premium segment was Breyer's, which was founded in 1866 in Philadelphia. Drie to confusion between the names of Breyer's and Dreyer's, in 1978 Dreyer's agreed to use the Edy's brand name east of the Rocky Mountains. In 1993, Breyer's was purchased by Unilever PLC, a conglomerate based in the U.K. It was the major competitor of Nestl in the global ice cream market. (See Exhibit 10.) After the sale, Breyer's was merged with Unilever's Good Humor ice cream subsidiary. The Breyer's brands had approximately $500 million in sales and 12% of the premium market. It had recently become a direct threat to the superpremium segment as more consumers began "trading down" to less expensive products. At the same time, it was rumored that Unilever was seeking to acquire a brand in the superpremium segment, the only remaining portion of the industry in which it was not involved. There was much speculation that the company would make an offer to purchase Hagen-Dazs in an effort to dominate the growing international market for superpremium ice cream. Ben & Jerry's By 1995, Ben and Jerry's had established itself as the number two maker of superpremium ice cream in the United States (behind Hagen-Dazs), with a market share of 43%, which was up from nearly 30% in 1990. The remaining sales of superpremium ice cream were divided among a number of small firms, including Columbo Gourmet and Elan. Ben & Jerry's continued to develop unusual flavors. The "down-home Vermont" image of Ben & Jerry's packaging and logo had also become a popular brand icon. In some of its internal policies, the company culture remained true to its iconoclastic and unconventional roots, while in other respects the firm had become more conventional as the business had matured. Product Development Flavor differentiation was an essential factor in the growth of Ben & Jerry's product lines. The company steadily added new flavors and eliminated slower-moving flavors in order to maintain a constantly improving selection. The company used no formal market research or test market procedures, relying instead on the founders' own ideas and tastes. Ben & Jerry's added several new flavors in 1990, including Chocolate Fudge Brownie and Rainforest Crunch, which contributed to the company's 24% volume increase by late 1990. In 1992, Chocolate Chip Cookie Dough became so popular that it contributed to 20% of all of the company's ice cream sales.15 Ben & Jerry's new "Smooth, No Chunks" ice cream line, featuring eight new flavors, captured 6% market share in its first year (1994), but Hagen-Dazs continued to dominate the "smooth sub-segment.16 To address the lower fat trend, Ben & Jerry's introduced a line of superpremium frozen yogut in 1992. With very little advertising, the product quickly rose to the number one frozen yogut in the U.S. by the end of 1994. With a sales increase of 34% to $44 million, it outperformed Hagen-Dazs, which had growth of just 14% and sales of only $26.5 million.7 The introduction of new products stretched the firm's capabilities. Chuck Lacey, Ben & Jerry's president, explained: In the last two years we have more than doubled the number of pint products we offer. This has increased the complexity of our business, which has highlighted inefficiencies in our production planning purchasing, and inventory management, all of which are impacting the company's gross margins. 28 By 1994, the number of Ben & Jerry's flavors had grown to 44, including ice cream, and frozen yogut flavors, up from an average of 14 during the 1980s.19 This number had the potential to grow even further as the company considered expanding into the growing markets of ice cream novelties and low-and nonfat ice cream alternatives. Manufacturing In 1994, Ben & Jerry's produced 60% of its ice cream, while Dreyer's produced the rest (approximately 5 million gallons) at its plant in Indiana.20 Ben & Jerry's management saw this arrangement as a stopgap, enabling the firm to enter new markets more quickly than it could add production capacity. To uphold Ben & Jerry's made-in-Vermont trademark, dairy products were shipped from Vermont to Indiana for processing in the Dreyer's plant. Ben & Jerry's reliance upon Dreyer's for production made it especially vulnerable to Dreyer's own plans for expansion. 21 Ben & Jerry's operated two production facilities itself, both located in Vermont. The Waterbury plant produced ice cream and frozen yogurt pints and had a capacity for up to 5 million gallons per year. The Springfield plant made ice cream novelties, as well as bulk ice cream and frozen yogurt. The facility produced approximately 1.2 million dozen novelties and 2.3 million gallons of bulk ice cream and frozen yogurt in 1994.22 The company also planned to open a third factory in St. Alban's, Vermont, in an effort to bring back in-house much of the volume currently produced by Dreyer's. Costing $40 million, the new plant would employ a state-of-the-art automated manufacturing system with a maximum capacity of 12 million gallons of packaged pints per year.23 Unfortunately, the St. Albans plant experienced significant delays due to problems with automated handling processes and refrigeration equipment.24 Following a report by an outside engineering firm with experience in the refrigerated food industry, the company chose to abandon a number of automated systems in favor of simpler, proven processes. This resulted in a $6.8 million write-down, which contributed to the company's fourth quarter loss in 1994.25 Ben & Jerry's products came in a wide range of innovative flavors and were made with only Vermont dairy products. The above-market premium of a few cents a gallon paid for Vermont dairy products reduced margins but was thought to be outweighed by the image of quality and purity that the policy conveyed. Ben & Jerry's ice cream contained no artificial ingredients or preservatives, although some of the candy and cookies used in various flavors did. The company claimed to add 1.5 to 2.5 times more flavorings to its products than any other competitor. This standard was rumored to have originated because Ben had a sinus problem and thus had difficulty tasting any flavor unless it was quite potent. These strict ingredient requirements, plus the difficulties involved in manufacturing ice cream with large chunks, posed a constant challenge to Ben & Jerry's manufacturing operations. Throughout 1994, as the company struggled with the increasing complexity of the business, it had difficulty forecasting demand and maintaining production efficiencies. As a result it suffered from shortages of some flavors and overstock (which had to be thrown away) of other flavors. Distribution Ben & Jerry's had two primary distributors, Dreyer's Grand Ice Cream, Inc. and Sut's Premium Ice Cream, as well as several other local distributors that serviced limited market areas. In 1994, sales through Dreyer's accounted for 52% of Ben & Jerry's total sales. Dreyer's distributed Ben & Jerry's in all of the company's markets except New England, Florida, and Texas. Sut's distributed Ben & Jerry's in parts of New England. With this distribution arrangement, 50% of Ben & Jerry's ice cream traveled less than 1,000 miles while 30% traveled more than 3,000 miles. Using heavy-duty commercial carriers, the company delivered 2,337 truckloads of product over 3.5 million miles, approximately 26 pints per mile traveled. By 1994, Ben & Jerry's was available in most stores that carried superpremium ice cream. Marketing In keeping with the company's unconventional style, Ben & Jerry's traditionally spent no money on advertising. Since the early days of the company, Ben Cohen and Jerry Greenfield had enjoyed great success in attracting unpaid media attention in their efforts to raise public awareness on a host of social issues. The company's annual meetings became highly publicized "events," with several days' worth of activities promoting causes such as world peace and environmental protection. The Ben & Jerry's factory tour in its Waterbury plant became the most popular tourist attraction in Vermont. In 1994, the free publicity the firm received on television programs such as CNN's Moneyline, The Larry King Show, and NBC's The Today Show was estimated by Ben & Jerry's to be worth $5.5 million. In that same year, print media features on Ben & Jerry's reached an estimated 70 million people. However, as the market grew more competitive and Ben & Jerry's sales growth began to slow down, the company was forced to spend money on advertising and in-store discounts. In 1994, Ben & Jerry's launched its first television advertising campaign for a new product line called "Smooth, No Chunks." The company's "official" reason for developing this line was that Ben Cohen got tired of chewing the big chunks in their mix-in ice cream. More practically, this new, higher margin product was developed to compete directly against Hagen-Dazs's traditional flavors. As a distinct change from what consumers expected of Ben & Jerry's products, "Smooth, No Chunks" was thought to require significant media exposure to succeed. Costing $6 million, the ads featured celebrities such as the anti-Vietnam activist Daniel Berrigan, the folk-singer Pete Seeger, and the filmmaker Spike Lee.28 In 1987, the company had granted an exclusive license to manufacture and sell their ice cream in Israel. Ben & Jerry's entered the U.K. market in March 1994, selling to specialty stores and key retailers, with sales of $7 million. It also began a joint venture, Iceverks, to manufacture ice cream for the Russian market. In the black by 1994, Iceverks was given the go ahead to expand by 1995. However, the lack of modern wholesale distribution systems in Russia remained an impediment to gaining greater market share.30 Ben & Jerry's had also explored the possibility of entering additional overseas markets such as Europe and the Pacific Rim. (See Exhibit 12.) Retail Stores Ben & Jerry's franchised retail stores, known as "scoop shops," were an integral part of the company's growth during its early years. By 1994, over 100 shops existed in the U.S., four in Canada, one in Israel, and a joint venture in Karelia, Vermont's sister state in the former Soviet Union.31 While the scoop shops were an excellent means for raising brand awareness and serving as a testing ground for new products and flavors, scoop shops accounted for only 3% of total company sales in 1994, and during this year only 5 new scoop shops were opened.32 The shops had never exceeded 10% of total revenues in the history of the company In the early 1990s, Ben & Jerry's suspended its franchising activities due to concern that rapid growth would result in a loss of control, especially over how the unique Ben & Jerry's image was to be conveyed. However, in late 1994, with a number of new products in place, the company embarked on a new, more closely controlled franchise program. This time, franchising sites were "real-estate driven," emphasizing high profile sites with strong potential for ice cream retail traffic as the key. The renewed focus on scoop shops led to plans for 25 new shops in 1995.33 Two shops were to be opened at Atlanta's international airport prior to the 1996 Summer Olympics.34 The company projected its shops' sales volumes at twice the national average for franchising frozen dessert shops. New franchisees were required to be owner/operators and to show that they had a good understanding of "what Ben & Jerry's (was] all about." The company established annual franchisee meetings and workshops, as well as a network of existing franchisees as a resource for newcomers. In addition to sale through franchised "scoop shops," food service outlets (restaurants, cafeterias, hospitals, etc.) accounted for net sales of 2.5 gallon bulk containers - approximately 7% of Ben & Jerry's total sales. As 25% of all frozen desserts were sold via this channel, Ben & Jerry's was exploring options to expand this area of the business. Finance Ben & Jerry's first went public in June 1984. Under company policy, all of the initial public shareholders were Vermont residents. The first issue of 73,500 shares was made available at a low enough minimum quantity that the equivalent of one in every hundred Vermont families held an initial interest, and institutional holdings remained low. In 1995, Ben Cohen and Jerry Greenfield held 15% and 3% of the company's equity, respectively. Because they held disproportionate fractions of the class B shares (with special voting privileges), Ben & Jerry together controlled over 40% of the shareholders' voting rights. The company never issued dividends, preferring instead to reinvest its earnings for future growth. The company also tried to maintain a conservative debt-to-equity policy. (See Exhibit 2.) Human Resources Ben & Jerry's had a reputation for exceptionally progressive human resource policies. The company offered comprehensive employee benefits, on-site day care facilities, and free employee assistance programs to help with any type of personal problem. The company tried to create an atmosphere where employees could be "real." Dress was casual, the management philosophy was participatory, and hierarchy was viewed with suspicion and distaste. No organization chart existed, although jobs and responsibilities were generally understood. A key policy devised when the company was founded was the 5-to-1 salary ratio, which dictated a maximum spread between the lowest and the highest paid employees of five times- a dramatically narrower differential than was the norm in American business. This policy was embraced by many in the company as morally correct and in keeping with the company's socially minded philosophy. However, in recent years strong opposition toward the policy developed, with opponents claiming that it resulted in above-market compensation for the lower pay levels and a substantial penalty at the top levels. Pay constraints were becoming a barrier to hiring competent professionals for key positions while also providing limited incentive for mid-level employees to be promoted. The company ultimately changed the policy to a 7-to-1 ratio.36 However, with the policy's effectiveness and fairness still being questioned, even the higher ratio was violated when Bob Holland assumed the position of CEO, at a salary of $250,000.37 The Social Mission The growth and success of the firm has been neither intended nor expected by the two founders. In fact, they each had serious misgivings about the idea of building a substantial profit-making corporation. They both had a strong anti-business bias emanating from their radical backgrounds in the 1960s, and the fact that their scoop shop in rural Vermont had become a significant and well- known company was a somewhat uncomfortable surprise to them. As Ben commented in the March/April 1988 issue of New Age Journal, Jerry and I never planned on going into business, so we don't have your normal business head. We didn't go to business school. I didn't graduate from college. Jerry was going to pre- med when we opened up this homemade ice cream parlor pretty much on a lark. We were looking to make a livable wage, but we were not looking to get rich, and I think that's what's really different about us and our motivation to go into business. ... It's really interesting what you can do with business when you don't care about making a lot of money. In 1985, the Ben & Jerry's Foundation was established to fund community projects. It was financed by a 7.5% pre-tax profit contribution, the highest level of charitable contribution of any U.S. public company. The joint venture agreement in the former Soviet Union was designed to foster international cooperation and global understanding while providing a model of small-scale private enterprise. Even ingredient sourcing was pursued with a social purpose. For example, a Native American farming group supplied all the blueberries for the Wild Maine Blueberry flavor. A New York bakery run by homeless people supplied all the brownies for the Chocolate Fudge Brownie flavor, while the Rainforest Crunch flavor used nuts from a Brazilian forest people's nut-shelling cooperative. As the company gained recognition and succeeded financially, the need to be more explicit about the role of social activism in the company increased. As a result, a company mission statement was developed (see Exhibit 13.) in which three elements - product, economic, and social - were treated with equal importance. This theme was reinforced by Ben in a statement in the 1989 annual report: It's our objective to run Ben & Jerry's for long-term financial and social gain. We are becoming more comfortable and adept at functioning with a two-part bottom line, where our company's success is measured by both our financial and our social performance... We are convinced that the two are intertwined. And, we are convinced that attention to excellence, quality, and the social needs of our communities will lead to solid, stable growth of both our bottom lines. However, in 1994 some of the company's social initiatives were under growing scrutiny. The press claimed that very few of the Brazil nuts used in the Rainforest Crunch flavor were actually purchased from indigenous peoples. Some experts claimed Ben & Jerry's activities were having a damaging effect on tribal cultures. At the same time, the company was being criticized for terminating its relationship with the New York bakery that had produced apple pies for the Apple Pie Frozen Yogurt flavor, when demand for the product fell.39 Looking Ahead With the enthusiasm of a newcomer and an exceptional business track record, Bob Holland faced the challenge of developing a strategy that not only addressed Ben & Jerry's current competitive difficulties, but was also consistent with the company's unique mission and background. Exhibit 1 Ben & Jerry's Total Return to Stockholders vs. S&P 500 Index - 1/1/1991 to 12/31/1994 BJICA Daily SP500 - 12/30/94 +4007 +3507 +3007 +2507 +2007 +1507 +1007 +507 +07 -507 Volume - BigCharts.com Thousands 92 93 94 January 1995 stock price range: 95/8 - 111/4 Shares outstanding: 7.245 million 796-109-12- Exhibit 2 Ben & Jerry's Financial Highlights ($000) 1985 1986 1987 1988 1989 1990 1991 1992 1993 1994 9,858 7,321 2,537 1,812 725 19,954 14,144 5,810 4,101 1,709 31,838 22,673 9,165 6,774 2,391 47.561 33,935 13,626 10,665 2,971 58,464 41,660 16,804 13,009 3,795 77,024 54,203 22,821 17,639 5,182 96,997 68,500 28,497 21,264 7,233 131,969 94,389 37,579 26,243 11,337 140,328 100,210 40,118 28,270 11,848 Net sales Cost of sales Gross profit Selling, general & admin. Operating income Asset write-down Other income (expense)-net Income before tax Income tax Net income (loss) 148,802 109,760 39,041 36,253 2,789 6,779 229 -3,762 -1,893 -1,869 -709 -31 694 143 551 208 1,917 901 1,016 305 2,696 1.251 1,445 -274 2,697 1,079 1,618 -362 3,433 1,380 2,053 4,473 1,864 2,609 -729 6,504 2,765 3,739 -23 11,314 4,639 6,675 197 12,045 4,845 7,201 Balance sheet data: Cash & investments Working capital Total assets Long-term debt Stockholder's equity 5,361 4,955 11,076 2,582 6,683 3,400 3,678 12,805 2.442 7,758 1,566 3,902 20,160 8,330 9,231 2,462 5,614 26,307 9,670 11,245 2,393 5,829 28,139 9,328 13,405 769 8,202 34,299 8,948 16, 101 6,704 11,035 43,056 2,787 26,269 32,556 18,053 88,207 2,641 66,760 36,705 29,292 106,361 18,002 74.262 28.777 37,456 120,295 32.419 72,502 Source: Compiled from the Ben & Jerry's 1990 Annual Report and the Ben & Jerry's 1994 Annual Report Exhibit 4 U.S. Per Capita Production of Ice Cream and Related Products (quarts) 1987 1988 1989 1990 1991 1992 1993 1994 Ice Cream Ice Milk Frozen Yogurt Sherbet Water Ices Other Frozen Dairy Products Total Frozen Products 15.33 5.41 0.82 0.78 0.81 23.15 14.43 5.8 0.85 0.82 0.8 22.7 13.47 6.1 1.34 0.85 0.8 0.7 23.26 13.21 5.65 1.89 0.81 0.81 0.52 22.89 13.68 5.42 2.33 0.75 0.89 0.57 23.64 13.58 5.15 2.1 0.78 0.83 0.81 23.25 13.42 5.04 2.32 0.79 0.9 1.02 23.49 13.47 5.53 2.32 0.84 0.98 0.92 24.06 Source: Compiled from International Ice Cream Association data. Exhibit 5 U.S. Per Capita Production of Ice Cream and Frozen Yogurt by Regions (quarts) 1991 1992 1993 1994 15.7 15.6 9.7 9.4 Ice Cream North Atlantic South Atlantic E.N. Central W.N. Central South Central West Total U.S. 14.7 24.7 11.0 12.9 15.1 9.6 15.0 24.5 10.7 13.1 13.6 16.0 23.4 9.3 12.7 13.4 15.1 10.1 15.3 24.4 9.4 13.1 13.5 13.7 2.6 2.0 Frozen Yogurt North Atlantic South Atlantic E.N. Central W.N. Central South Central West Total U.S. 2.1 2.1 wiwoy 3.1 3.1 1.7 1.7 2.1 23 Source: Compiled from International Ice Cream Association data. Exhibit 6 Ice Cream Market Share Segmented According to Butterfat Content 1985 1990 1993 1994 14% 14% 10% Economy Regular Premium Superpremium 35 50 20 38 11% 36 41 3 1 13 Source: Compiled from International Ice Cream Association data. Exhibit 7 Highest Quality Ice Cream Manufacturing Cost Structure Sample Percentage of Net Sales no Cost of Sales: Milk Ingredients Containers Plant Costs: Labor Other expenses Sales and Distribution Costs: Delivery and sales Administration Plant operating profit (before income tax) w Source: Casewriter's analysis. Exhibit 8 Ice Cream Flavors: Total U.S. Volume Share Share (%) 1994 1995 Flavor 29 28.1 15.2 13.5 8.1 10.5 Vanilla Fruit Almond/Nut/Pistachio/Other Candy Mix-ins Chocolate Cake/Cookie Neapolitan All Other Flavors Coffee/Mocha NOON W no SM 10.4 7.3 8.6 12.3 1.8 Source: Compiled from International Ice Cream Association data. Exhibit 9 Frozen Dessert Advertising Spending Leading Brands (5000) 1991 1992 1993 1994 Good Humor Ice Cream National Dairy Board Edy's Ice Cream DoveBar Breyer's Ice Cream $ 515 4,766 1,476 899 1,871 $6,427 5,704 3,603 3,459 3,053 $7,017 4,956 3,871 2,873 5,795 $6,281 1,962 12,601 3,432 7,868 Source: Adapted from AD & Summary. Exhibit 10 Competitors' Financial Highlightsa Grand Metropolitan PLC (million British ) 1993 1994 Unilever (million British E) 1993 Nestl (million Swiss Francs) 1993 1994 1994 Sales Profit before taxes Net income Assets less current liabilities Long-term debt Shareholder's equity 8,120 625 410 6,045 3,713 3,144 7,780 654 450 6,544 3,587 3,007 27,863 1,927 1,296 8,075 1,746 4,703 29,666 2,519 1,559 6,697 2,454 5,333 57,486 4,644 2,887 45,160 10,424 15,660 56,894 5,067 3,250 45,227 10,156 16,944 Source: Compiled from 1994 Grand Metropolitan PLC Annual Report, 1994 Unilever Annual Review, and 1994 Nestl Annual Report The British Pound was equivalent to US $1.54; the Swiss Franc was equivalent to US$0.86. Exhibit 11 Dreyer's Grand Ice Cream Financial Highlights (5000) 1992 1993 1994 Net sales Cost of sales Gross profit Selling, general & admin. Operating income Other income (expense) Income before tax Income tax Net income 407,045 314,762 92,283 65,450 26,833 (4,332) 22,501 8,528 13,973 470,665 356,237 114,428 79,779 34,649 (6,678) 27,971 1,182 16,789 564,372 428,779 135,593 126,945 8,648 (7,013) 1,635 634 1,001 Balance Sheet Data: Working capital Total assets Long-term debt Shareholder's equity 25,768 289,051 102,160 107,569 57,397 322,275 38,875 123,034 48,403 362,026 46,100 135,921 Source: Compiled from 1994 Dreyer's Grand Ice Cream, Inc. Annual Report. Exhibit 12 International Per Capita Production of Frozen Desserts (U.S. Pints) Australia Sweden Canada Japan Italy Norway United States New Zealand Spain Germany France Chile Greece India Argentina Mexico United Kingdom Colombia Source: Adapted from International Ice Cream Association data. Exhibit 13 Ben & Jerry's Statement of Mission Ben & Jerry's is dedicated to the creation and demonstration of a new corporate concept of linked prosperity. Our Mission consists of three interrelated parts: Product, Economic, and Social. Underlying the mission of Ben & Jerry's is the determination to seek new and creative ways of addressing all three parts, while holding a deep respect for individuals inside and outside that company and for the communities of which they are a part. Product Mission To make, distribute and sell the finest quality all natural ice cream and related products in a wide variety of innovative flavors made from Vermont dairy products. Economic Mission To operate the company on a sound financial basis of profitable growth, increasing value for our shareholders and increasing career opportunities and financial rewards for our employees. Social Mission To operate the company in a way that actively recognizes the central role that business plays in the structure of society by instigating innovative ways to improve the quality of life of a broad community: local, national and international. Source: Ben & Jerry's 1994 Annual Report


