

Question: question in screenshot Consider a probability histogram for the number of times I win if I bet $5 on even numbers in roulette. Which of
question in screenshot
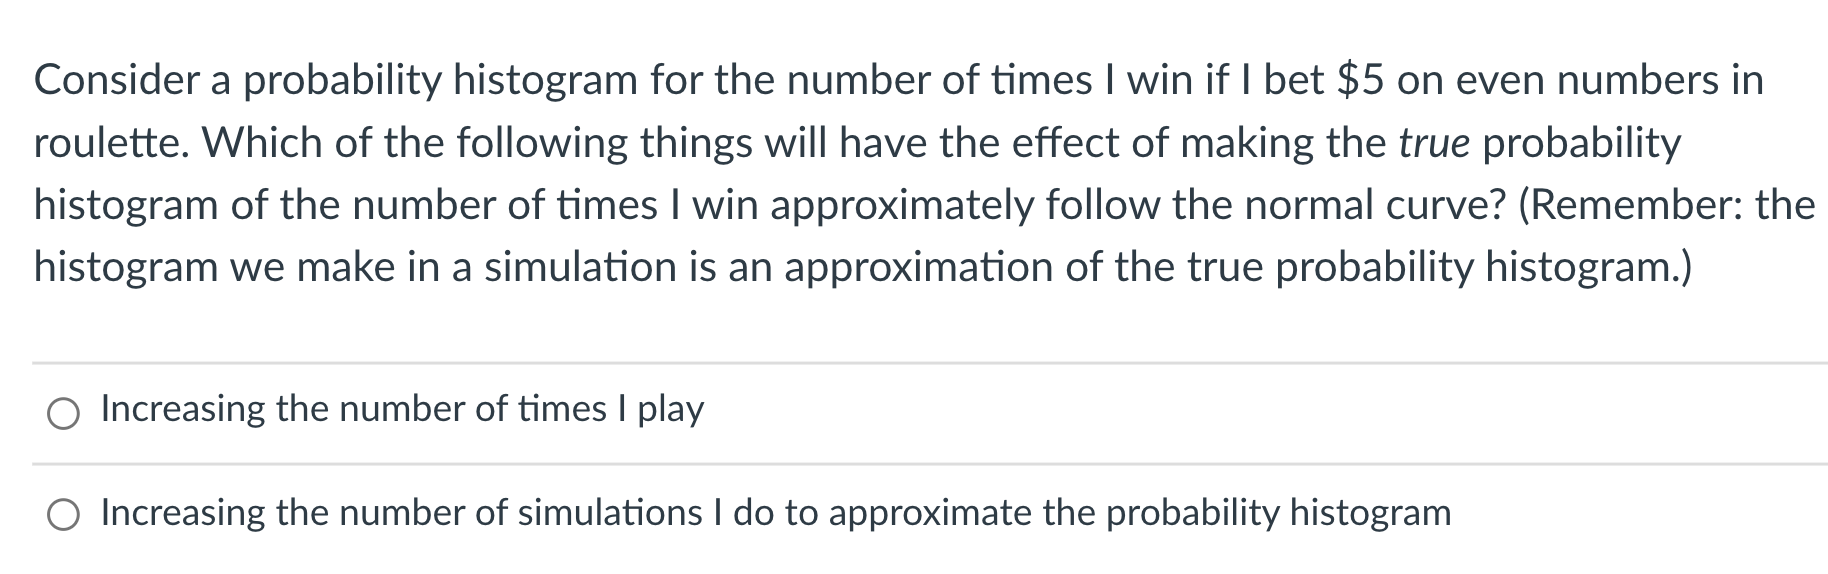
Consider a probability histogram for the number of times I win if I bet $5 on even numbers in roulette. Which of the following things will have the effect of making the true probability histogram of the number of times I win approximately follow the normal curve? (Remember: the histogram we make in a simulation is an approximation of the true probability histogram.) 0 Increasing the number of times | play 0 Increasing the number of simulations I do to approximate the probability histogram
Step by Step Solution
There are 3 Steps involved in it
1 Expert Approved Answer
Step: 1 Unlock

Question Has Been Solved by an Expert!
Get step-by-step solutions from verified subject matter experts
Step: 2 Unlock
Step: 3 Unlock