

Question: Question is in image The table below lists the number of games played in a yearly best-of-seven baseball championship series, along with the expected proportions
Question is in image
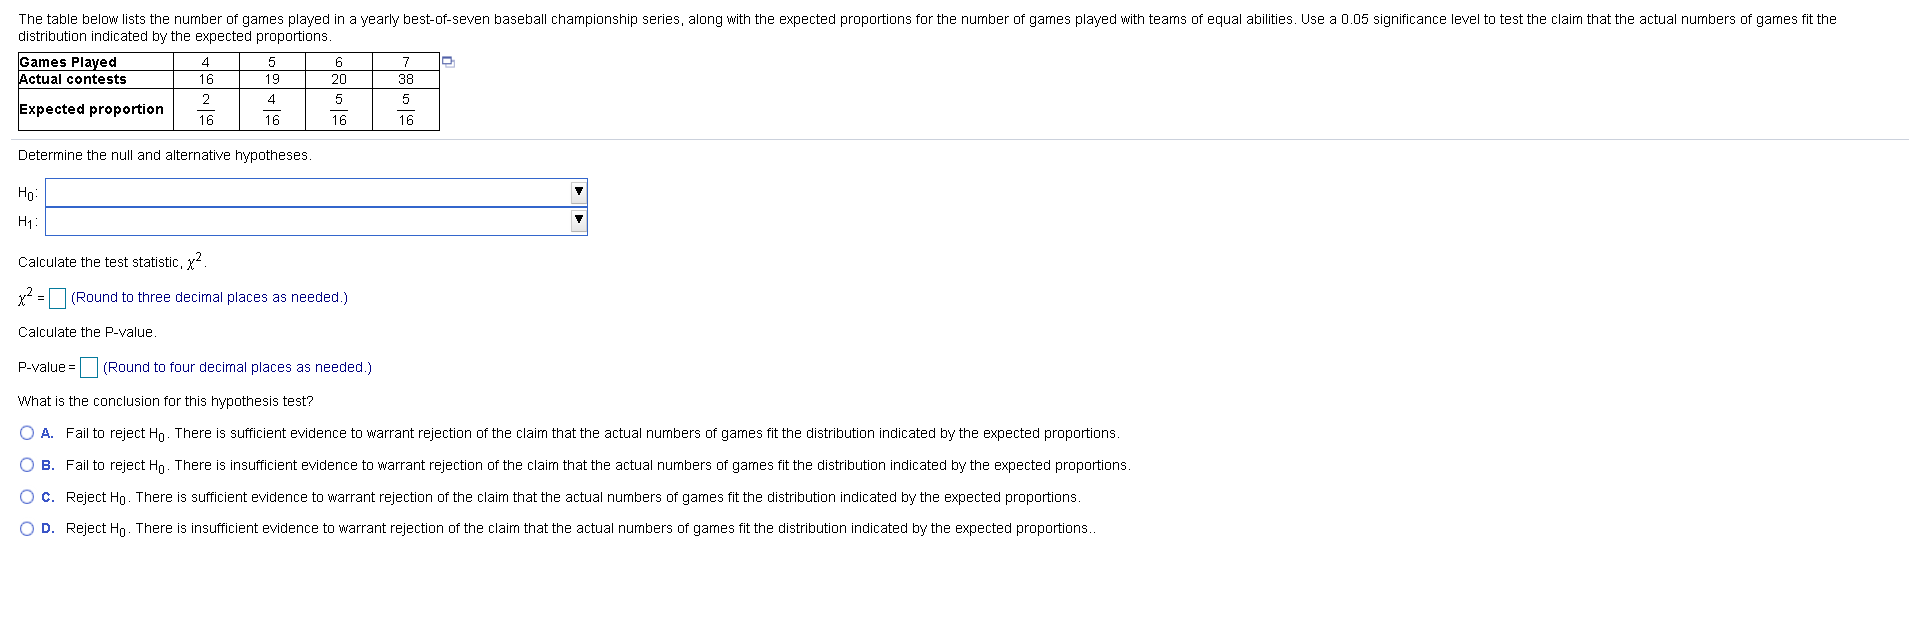
The table below lists the number of games played in a yearly best-of-seven baseball championship series, along with the expected proportions for the number of games played with teams of equal abilities. Use a 0.05 significance level to test the claim that the actual numbers of games fit the distribution indicated by the expected proportions. Games Played 4 5 6 7 Actual contests 16 19 20 38 2 4 5 5 Expected proportion 16 16 16 16 Determine the null and alternative hypotheses. Ho: H 1 : Calculate the test statistic, x x2 = (Round to three decimal places as needed.) Calculate the P-value P-value = (Round to four decimal places as needed.) What is the conclusion for this hypothesis test? O A. Fail to reject Ho. There is sufficient evidence to warrant rejection of the claim that the actual numbers of games fit the distribution indicated by the expected proportions. O B. Fail to reject Ho. There is insufficient evidence to warrant rejection of the claim that the actual numbers of games fit the distribution indicated by the expected proportions. O C. Reject Ho. There is sufficient evidence to warrant rejection of the claim that the actual numbers of games fit the distribution indicated by the expected proportions. O D. Reject Ho. There is insufficient evidence to warrant rejection of the claim that the actual numbers of games fit the distribution indicated by the expected proportions
Step by Step Solution
There are 3 Steps involved in it

Get step-by-step solutions from verified subject matter experts