

Question: Question is pictured Q1: What's wrong with this graph? Massive Increase in housing costs! Average HOUSE $32000 cost w $81,000 $80,000
Question is pictured
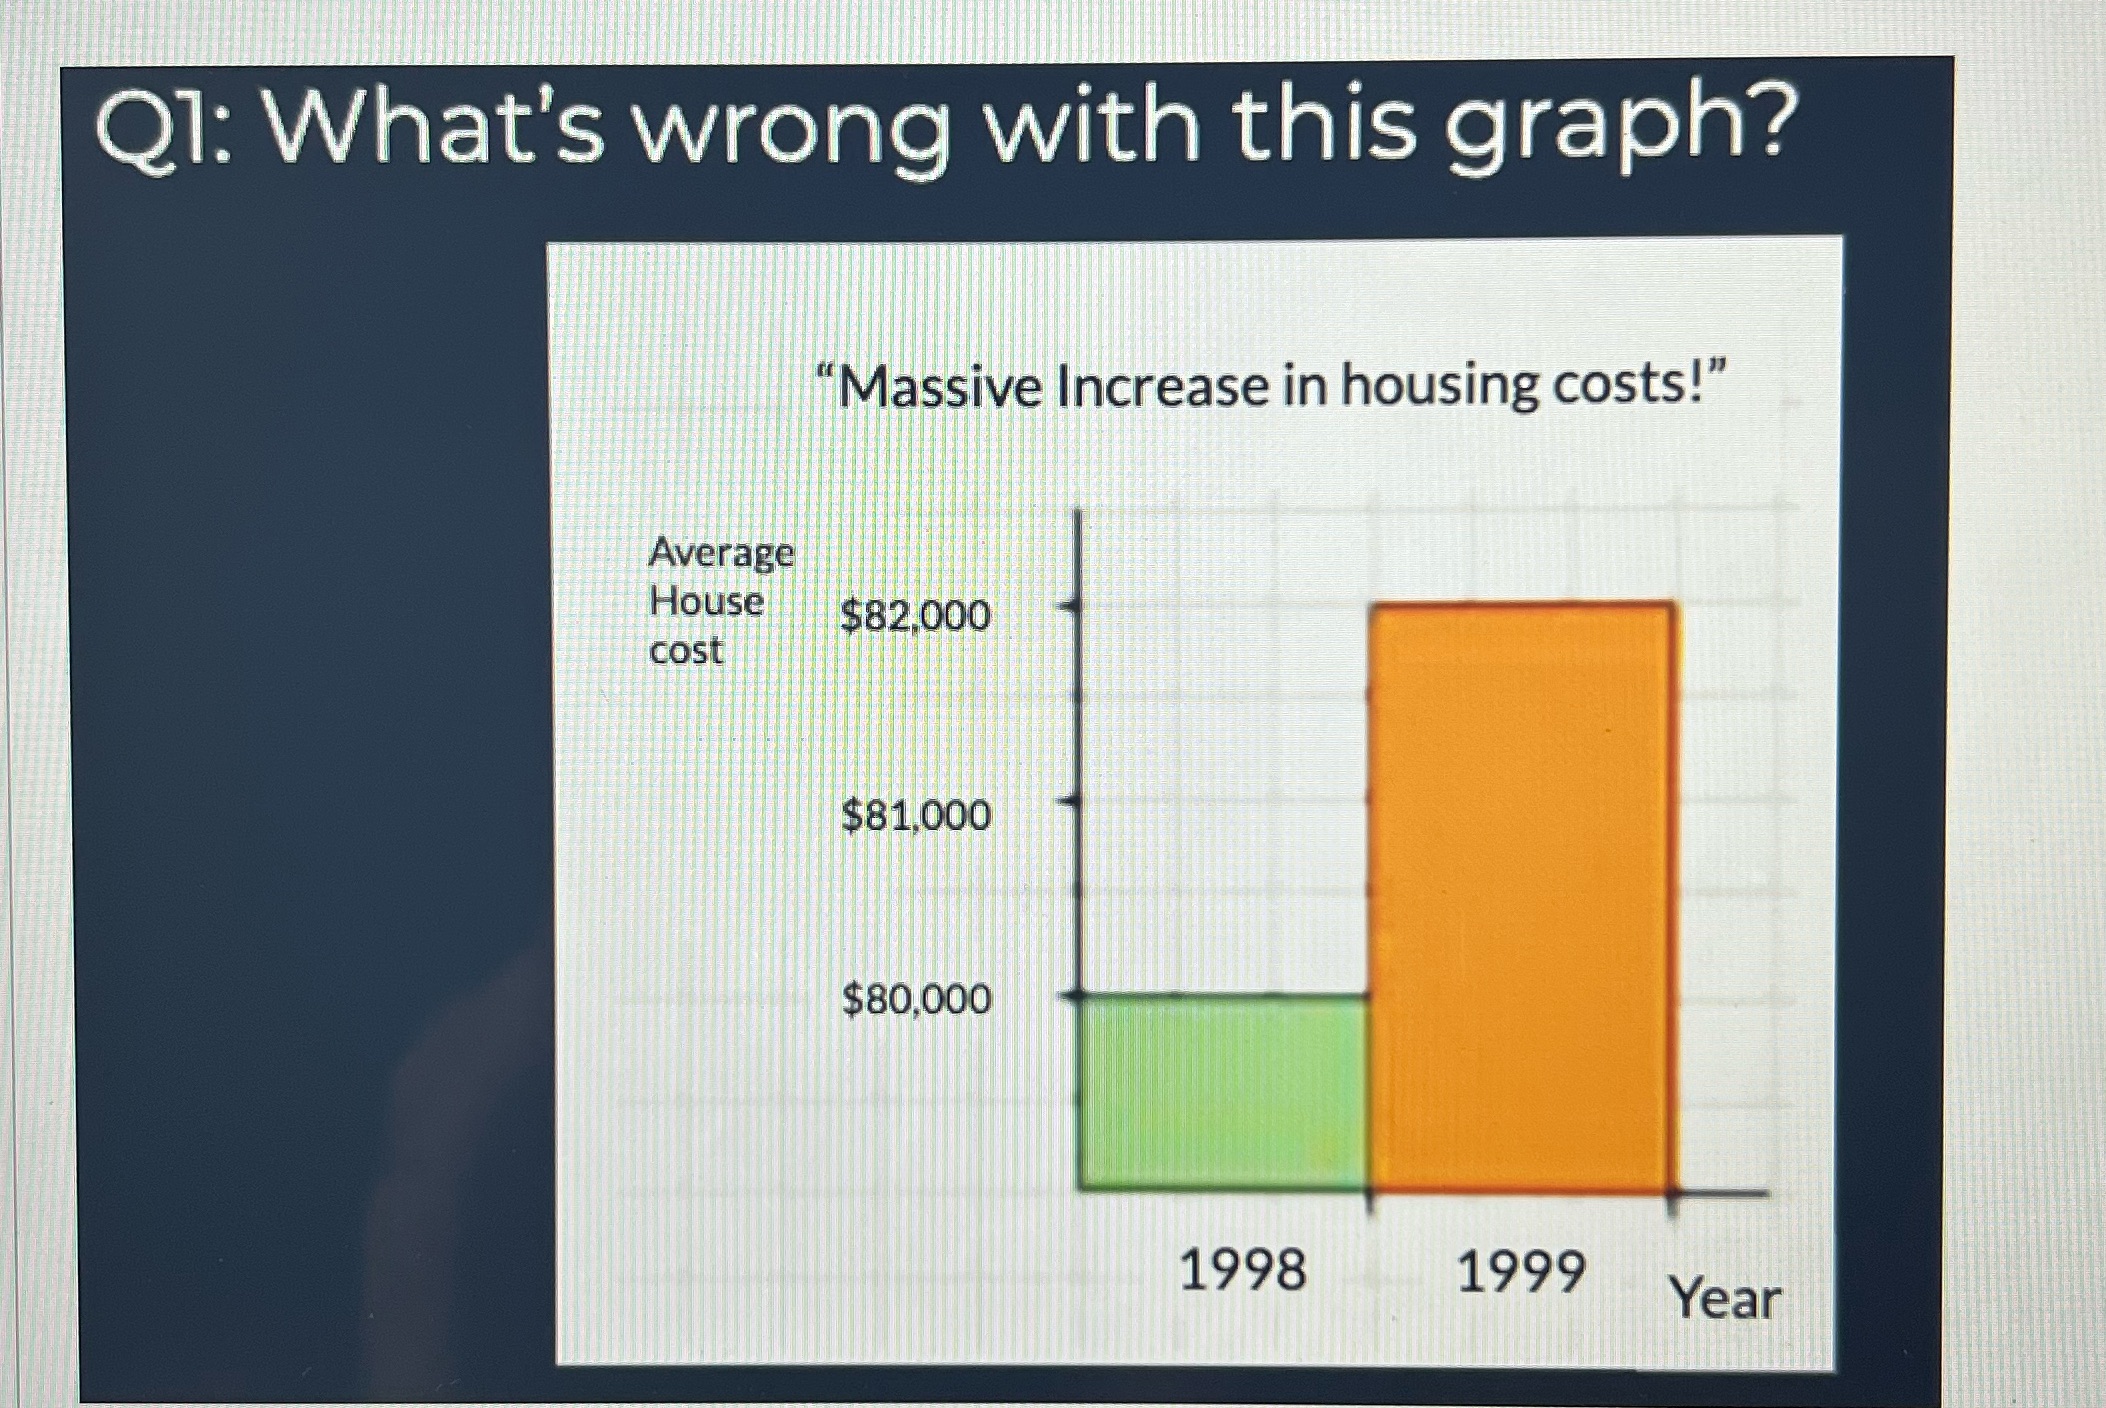
Q1: What's wrong with this graph? \"Massive Increase in housing costs!" Average HOUSE $32000 cost w $81,000 $80,000
Step by Step Solution
There are 3 Steps involved in it
1 Expert Approved Answer
Step: 1 Unlock

Question Has Been Solved by an Expert!
Get step-by-step solutions from verified subject matter experts
Step: 2 Unlock
Step: 3 Unlock