

Question: Question needed for answer. 5. Suppose there are 10 people in the economy and two possible distributions: Distribution: 1 2 3 3 4 5 6
Question needed for answer.
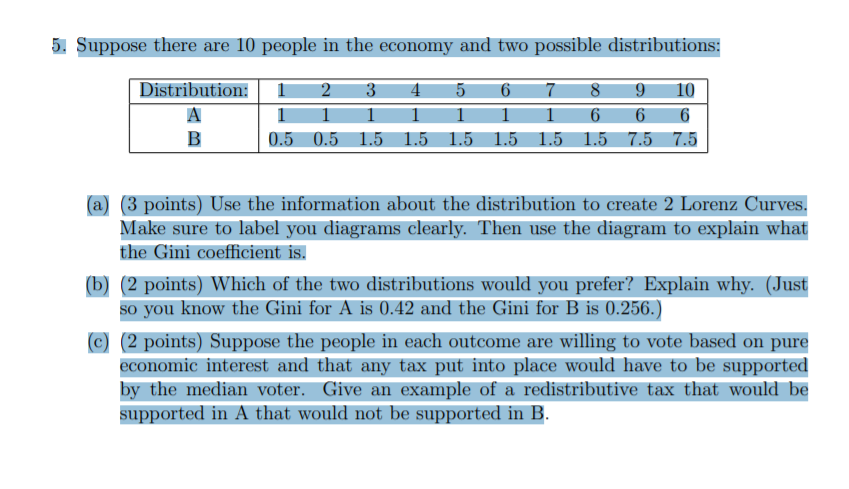
5. Suppose there are 10 people in the economy and two possible distributions: Distribution: 1 2 3 3 4 5 6 7 8 9 10 A 1 6 6 6 B 0.5 0.5 1.5 1.5 1.5 1.5 1.5 1.5 7.5 7.5 (a) (3 points) Use the information about the distribution to create 2 Lorenz Curves. Make sure to label you diagrams clearly. Then use the diagram to explain what the Gini coefficient is. (b) (2 points) Which of the two distributions would you prefer? Explain why. (Just so you know the Gini for A is 0.42 and the Gini for B is 0.256.) c) (2 points) Suppose the people in each outcome are willing to vote based on pure economic interest and that any tax put into place would have to be supported by the median voter. Give an example of a redistributive tax that would be supported in A that would not be supported in B
Step by Step Solution
There are 3 Steps involved in it

Get step-by-step solutions from verified subject matter experts