

Question: Question no 1 2.1 The plot This question asks you to generate a plot in R. Plot a line, 3; 2 ma: + b, where
Question no 1


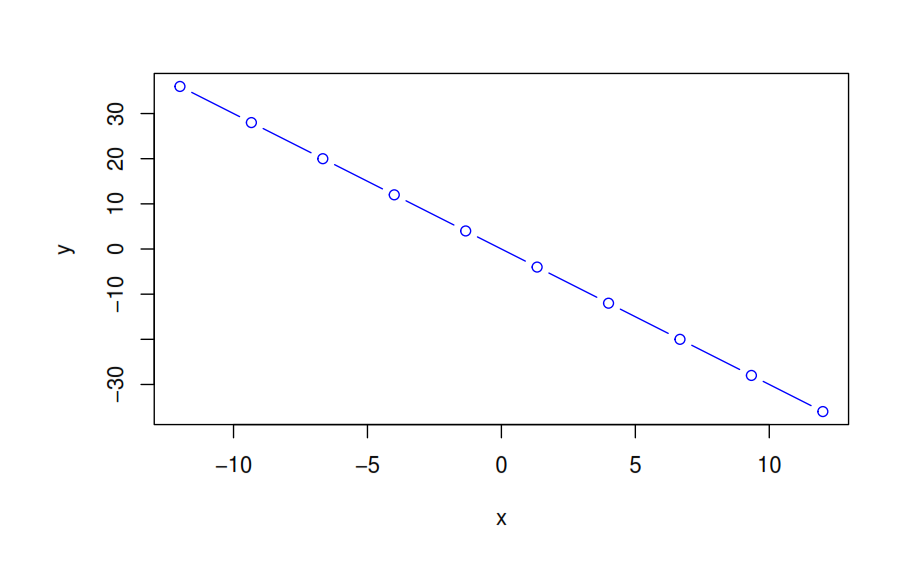
2.1 The plot This question asks you to generate a plot in R. Plot a line, 3; 2 ma: + b, where 3: ranges from -12 to 12. First you need to generate some :rs. Then you need to generate the ys to plot. How do you do that in R? For you plot, please plot both the points and the line and please use a blue line. You can do so by using the following options in your call to the function plot: . type = Mb" - col = "blue" You can look at the help for plot by typing ?plot in the Console. If you use too many LES, then seeing the points may be difcult. Please keep this in rnindI would like to see the points. Your plot should look something like this: O O O O O O O O -10 0 10 20 30 O 10 5 O -30 -5 X -10
Step by Step Solution
There are 3 Steps involved in it

Get step-by-step solutions from verified subject matter experts