

Question: Question No. 1 The raw data displayed here are the score (out of 20 marks) of a market survey regarding the acceptability of a
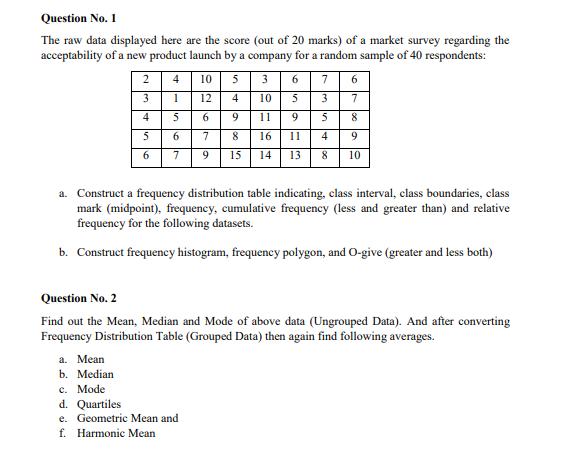
Question No. 1 The raw data displayed here are the score (out of 20 marks) of a market survey regarding the acceptability of a new product launch by a company for a random sample of 40 respondents: 10 76 12 6 7 9 2 3 4 5 6 4 1 l'a 5 167 6 7 5 4 3 6 10 5 9 11 9 8 16 11 15 14 13 a. Mean b. Median c. Mode d. Quartiles e. Geometric Mean and f. Harmonic Mean la 3 7 5 8 4 9 8 10 a. Construct a frequency distribution table indicating, class interval, class boundaries, class mark (midpoint), frequency, cumulative frequency (less and greater than) and relative frequency for the following datasets. b. Construct frequency histogram, frequency polygon, and O-give (greater and less both) Question No. 2 Find out the Mean, Median and Mode of above data (Ungrouped Data). And after converting Frequency Distribution Table (Grouped Data) then again find following averages.
Step by Step Solution
3.38 Rating (160 Votes )
There are 3 Steps involved in it

Get step-by-step solutions from verified subject matter experts