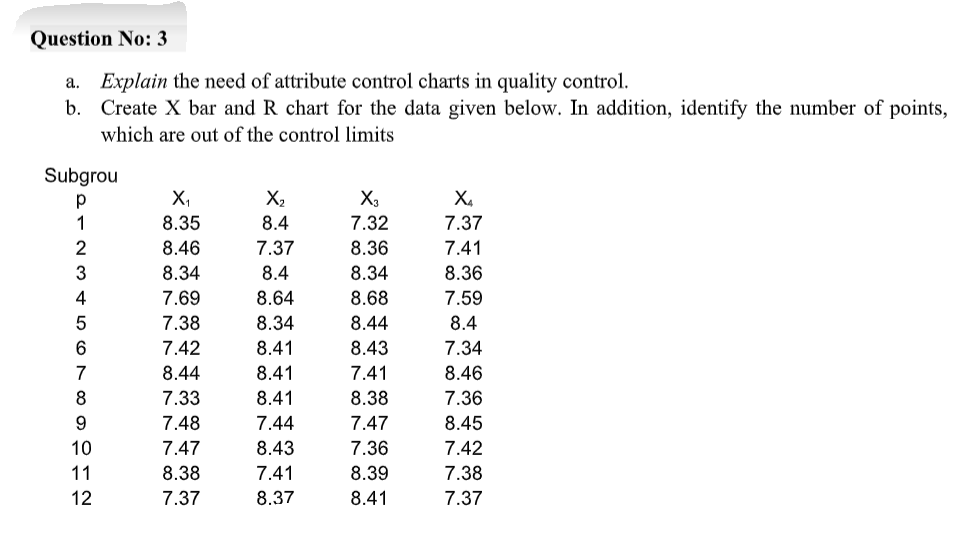
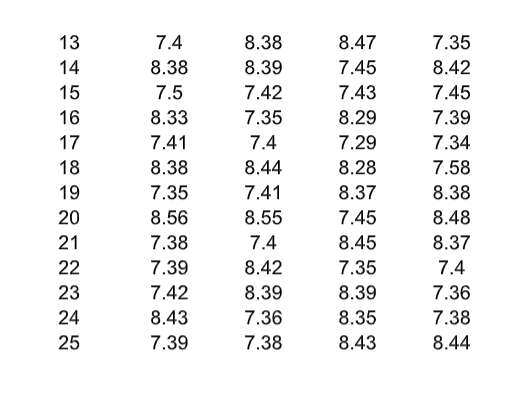
Question: Question No: 3 a. Explain the need of attribute control charts in quality control. b. Create X bar and R chart for the data given

Question No: 3 a. Explain the need of attributeQuestion No: 3 a. Explain the need of attribute

Question No: 3 a. Explain the need of attribute control charts in quality control. b. Create X bar and R chart for the data given below. In addition, identify the number of points, which are out of the control limits Subgrou 1 2 3 4 5 6 7 8 9 10 11 12 X 8.35 8.46 8.34 7.69 7.38 7.42 8.44 7.33 7.48 7.47 8.38 7.37 X 8.4 7.37 8.4 8.64 8.34 8.41 8.41 8.41 7.44 8.43 7.41 8.37 X, 7.32 8.36 8.34 8.68 8.44 8.43 7.41 8.38 7.47 7.36 8.39 8.41 X 7.37 7.41 8.36 7.59 8.4 7.34 8.46 7.36 8.45 7.42 7.38 7.37 13 14 15 16 17 18 19 20 21 22 23 24 25 7.4 8.38 7.5 8.33 7.41 8.38 7.35 8.56 7.38 7.39 7.42 8.43 7.39 8.38 8.39 7.42 7.35 7.4 8.44 7.41 8.55 7.4 8.42 8.39 7.36 7.38 8.47 7.45 7.43 8.29 7.29 8.28 8.37 7.45 8.45 7.35 8.39 8.35 8.43 7.35 8.42 7.45 7.39 7.34 7.58 8.38 8.48 8.37 7.4 7.36 7.38 8.44

Step by Step Solution

There are 3 Steps involved in it

1 Expert Approved Answer
Step: 1 Unlock blur-text-image
Question Has Been Solved by an Expert!

Get step-by-step solutions from verified subject matter experts

Step: 2 Unlock
Step: 3 Unlock

Students Have Also Explored These Related General Management Questions!