

Question: question on ANOVA: 1) For multiplication please use an asterix (ie *) eg 3 * 4 = 12 2) For division please use a slash
question on ANOVA:
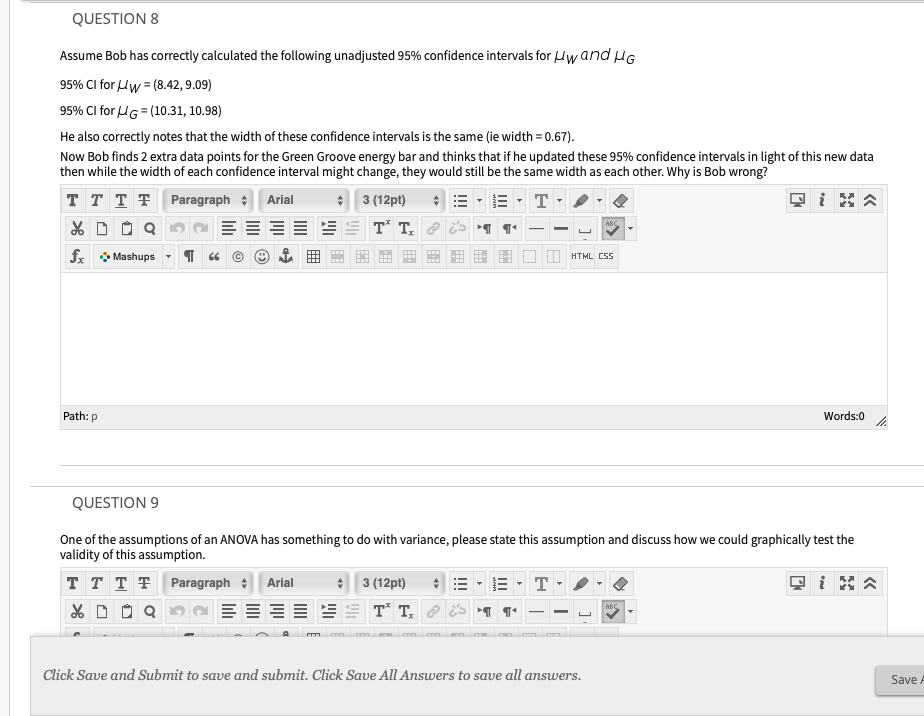
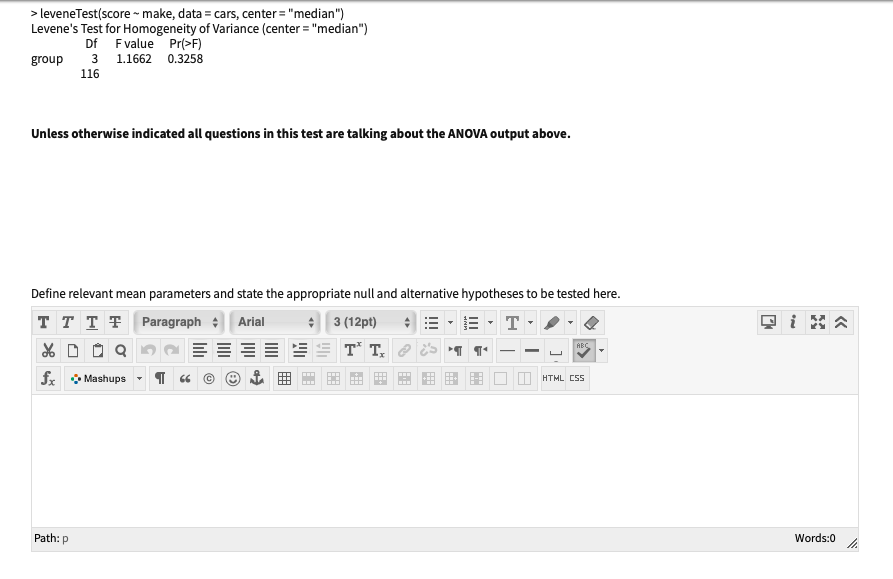
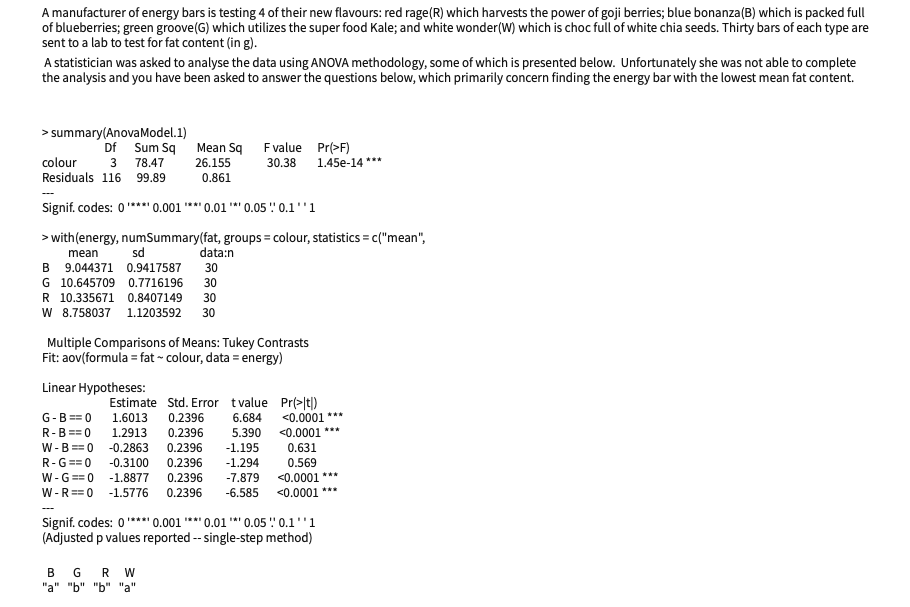
1) For multiplication please use an asterix (ie *) eg 3 * 4 = 12 2) For division please use a slash (ie /), you might need to use brackets to make it clear eg (4x + 2x) / 3 = 2x 3) For the mean of some data (ie x) write x-bar 4) For the square of a number (ie 32) please use the carrot or hat symbol, sometimes called the circumflex, (ie ^) eg 3^2 = 9. For a longer expression that is all being squared please use brackets eg (x-3)^2 5) For a square root use sqrt() eg sqrt(9) = 3. 6) For hypotheses use HO and HI for the null and alternative hypotheses respectively 7) For any greek letters just spell them out eg mu for u, sigma for o, etc. As we are dealing with ANOVA there are likely to be multiple means and standard deviations, to distinguish them we might usually write something like 1, 2 and u3 or HA, HB and HC etc. In the test you can use underscore (ie _) to show these subscripts, so mu_1 or mu A etc.QUESTION 2 What is the value of the mean squares between? TTTT Paragraph # Arial 3 (12pt) F T i Ha X D D Q E T T. ABC L fx Mashups C HI H H HTML CSS Path: p Words:0 QUESTION 3 Under HO what distribution does the test statistic follow? What is the observed value of the test statistic here?QUESTION 4 State the p-value, then perform the hypothesis test at a 5% level of significance and state your conclusion to this ANOVA analysis. TTTT Paragraph * Arial 3 (12pt) T Dia E T* Tx T ABC fx Mashups TA HTML CSS Path: p Words:0 QUESTION 5 Tukey's pairwise comparisons of means can sometimes be used to expand upon the ANOVA conclusion you gave in Q4. Explain why it is or isn't appropriate to use it in this particular analysis, and if it is appropriate, use them to describe which colour or colours of energy bar have the best fat rating (use p-values to make decisions and use or = 0.05 where needed). TTTF Paragraph * Arial 3 (12pt) E T . DiKa T* Tx fx Mashups - HTML CSSQUESTION 6 Explain which out of a type I or type II error could have happened here, and explain what the consequences of such an error would be. Explain how we could tell whether we had made such an error. TTTT Paragraph # Arial 3 (12pt) T T. T ABC fx Mashups - 1 4 0 HTML CSS Path: p Words:0 QUESTION 7 Calculate an unadjusted 99% confidence interval for /R - the population mean rating for the Red Rage energy bars. The magazine gives then energy bars one, two or three stars based on their health rating, with one star being awarded if they can be confident that the mean population fat content is more than 10g. Please use your confidence interval to discuss whether the magazine should award the Red Rage energy bars only one star. TTT F Paragraph # Arial 3 (12pt) ET . i TT, HEL fx Mashups + HTML CSSQUESTION 8 Assume Bob has correctly calculated the following unadjusted 95% confidence intervals for Uwand HG 95% Cl for HW = (8.42, 9.09) 95% Cl for JG = (10.31, 10.98) He also correctly notes that the width of these confidence intervals is the same (ie width = 0.67). Now Bob finds 2 extra data points for the Green Groove energy bar and thinks that if he updated these 95% confidence intervals in light of this new data then while the width of each confidence interval might change, they would still be the same width as each other. Why is Bob wrong? TTT F Paragraph # Arial # 3 (12p1) - - T - fx Mashups . 1 01 : 8:BBC Path: p Words:0 QUESTION 9 One of the assumptions of an ANOVA has something to do with variance, please state this assumption and discuss how we could graphically test the validity of this assumption. TTT F Paragraph # Arial # 3 (12pt) Click Save and Submit to save and submit. Click Save All Answers to save all answers. Save> leveneTest(score - make, data = cars, center = "median") Levene's Test for Homogeneity of Variance (center = "median") Df Fvalue Pr(>F) group 3 1.1662 0.3258 116 Unless otherwise indicated all questions in this test are talking about the ANOVA output above. Define relevant mean parameters and state the appropriate null and alternative hypotheses to be tested here. TTIF Paragraph + Arial 3 (12pt) IE T . X D D Q E ABC fx Mashups T HTML CSS Path: p Words:0 AA manufacturer of energy bars is testing 4 of their new flavours: red rage(R) which harvests the power of goji berries; blue bonanza(B) which is packed full of blueberries; green groove(G) which utilizes the super food Kale; and white wonder(W) which is choc full of white chia seeds. Thirty bars of each type are sent to a lab to test for fat content (in g). A statistician was asked to analyse the data using ANOVA methodology, some of which is presented below. Unfortunately she was not able to complete the analysis and you have been asked to answer the questions below, which primarily concern finding the energy bar with the lowest mean fat content. > summary(AnovaModel.1) Df Sum Sq Mean Sq Fvalue Pr(>F) colour 3 78.47 26.155 30.38 1.45e-14 * * * Residuals 116 99.89 0.861 Signif. codes: 0 0.001 0.01 0.05 0.1 "1 > with(energy, numSummary(fat, groups = colour, statistics = c("mean", mean sd data:n B 9.044371 0.9417587 30 G 10.645709 0.7716196 30 R 10.335671 0.8407149 30 W 8.758037 1.1203592 30 Multiple Comparisons of Means: Tukey Contrasts Fit: aov(formula = fat - colour, data = energy) Linear Hypotheses: Estimate Std. Error tvalue Pr(>|t)) G - B =0 1.6013 0.2396 6.684
Step by Step Solution
There are 3 Steps involved in it

Get step-by-step solutions from verified subject matter experts