

Question: Question One Use the Consumer Figures Case Study numbers (in the Word doc) and determine from an overall profitability standpoint, which is better: The starting
 Question One Use the Consumer Figures Case Study numbers (in the Word doc) and determine from an overall profitability standpoint, which is better:
-
- The starting numbers in the case
- OR
- An offer of 2 Honeybell Cheesecakes for $79.00 with the following changes
- 1.05% Average Response, 50% COGS, $8.00 Fulfillment, and Response per Year of 16%, 13%, and 11% (No other changes)
OR
- An offer of 2 Honeybell Cheesecakes for $70.00 with the following changes
- 1.15% Average Response, 55% COGS, $8.00 Fulfillment, and Response per Year of 17%, 14%, and 12% (No other changes)
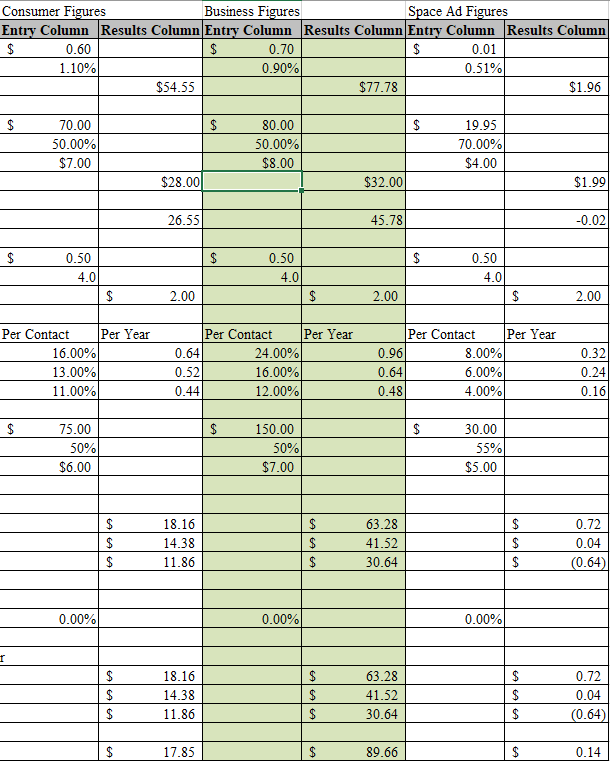
Consumer Figures Business Figures Space Ad Figures Entry Column Results Column Entry Column Results Column Entry Column Results Column | $ 0.60 | $ 0.70 | | | $ 0.01 1.10%| | 0.90%| | | 0.51%| $54.55 $77.78 $1.96] = = = | $ | | $ 70.00 | 50.00%| $7.00 | 40.00 | 50.00%| | $4.00 | _ 19 93 70.00% $4.00 $24.00 _ $32.00] $1.99| 26.55| | 45.74| | -0.02| | | $ | 0.50 4.0| | $ = 0.50 | 4.0| | $ 0.50 4.0| | $ | 2.00 2.00 | 2.00 Per Contact Per Year 16.00%| 13.00%| 11.00%| Per Contact Per Year | 0.64] 24.00%| 0.52| 16.00%| 0.44] 12.00%| Per Contact Per Year 0.96| .00%| 0.64] 6.00%| 0.48 | 4.00% | $ 75.00 50% $6.00 | 150.00 50%| $7.00 | | 30.00 55%| $5.00 | 18.16 14.34 11.86. | $ | $ | 63.24 41 52 30.64 0.72 0.04 (0.64)| 0.00%| 0.00%|| 0.00% 18.16. 14.34 11.86. 63.24 | 41.52| 30.64 0.72 | 0.04 | | $ ___| $ $ (0.64) 17.45] | | $ 89.66 | 0.14 | Consumer Figures Business Figures Space Ad Figures Entry Column Results Column Entry Column Results Column Entry Column Results Column | $ 0.60 | $ 0.70 | | | $ 0.01 1.10%| | 0.90%| | | 0.51%| $54.55 $77.78 $1.96] = = = | $ | | $ 70.00 | 50.00%| $7.00 | 40.00 | 50.00%| | $4.00 | _ 19 93 70.00% $4.00 $24.00 _ $32.00] $1.99| 26.55| | 45.74| | -0.02| | | $ | 0.50 4.0| | $ = 0.50 | 4.0| | $ 0.50 4.0| | $ | 2.00 2.00 | 2.00 Per Contact Per Year 16.00%| 13.00%| 11.00%| Per Contact Per Year | 0.64] 24.00%| 0.52| 16.00%| 0.44] 12.00%| Per Contact Per Year 0.96| .00%| 0.64] 6.00%| 0.48 | 4.00% | $ 75.00 50% $6.00 | 150.00 50%| $7.00 | | 30.00 55%| $5.00 | 18.16 14.34 11.86. | $ | $ | 63.24 41 52 30.64 0.72 0.04 (0.64)| 0.00%| 0.00%|| 0.00% 18.16. 14.34 11.86. 63.24 | 41.52| 30.64 0.72 | 0.04 | | $ ___| $ $ (0.64) 17.45] | | $ 89.66 | 0.14 |
Step by Step Solution
There are 3 Steps involved in it

Get step-by-step solutions from verified subject matter experts