

Question: Question: PLEASE RE DO PART A USING P - CHART Please note that this problem has three parts ( a , b , and c
Question: PLEASE RE DO PART A USING PCHART
Please note that this problem has three parts a b and c
You may need to scroll the screen down and navigate left and right to see the whole problem.
Clearly label your parts when answering.
You are allowed a Maximum of Files for this problem.
Show all calculationsresults to at least FOUR PLACES AFTER THE DECIMAL POINT except
when all succeeding digits are zeros
Must show work completely including all calculationssteps Failure to do so will result in
a score of even if your final answer is correct.
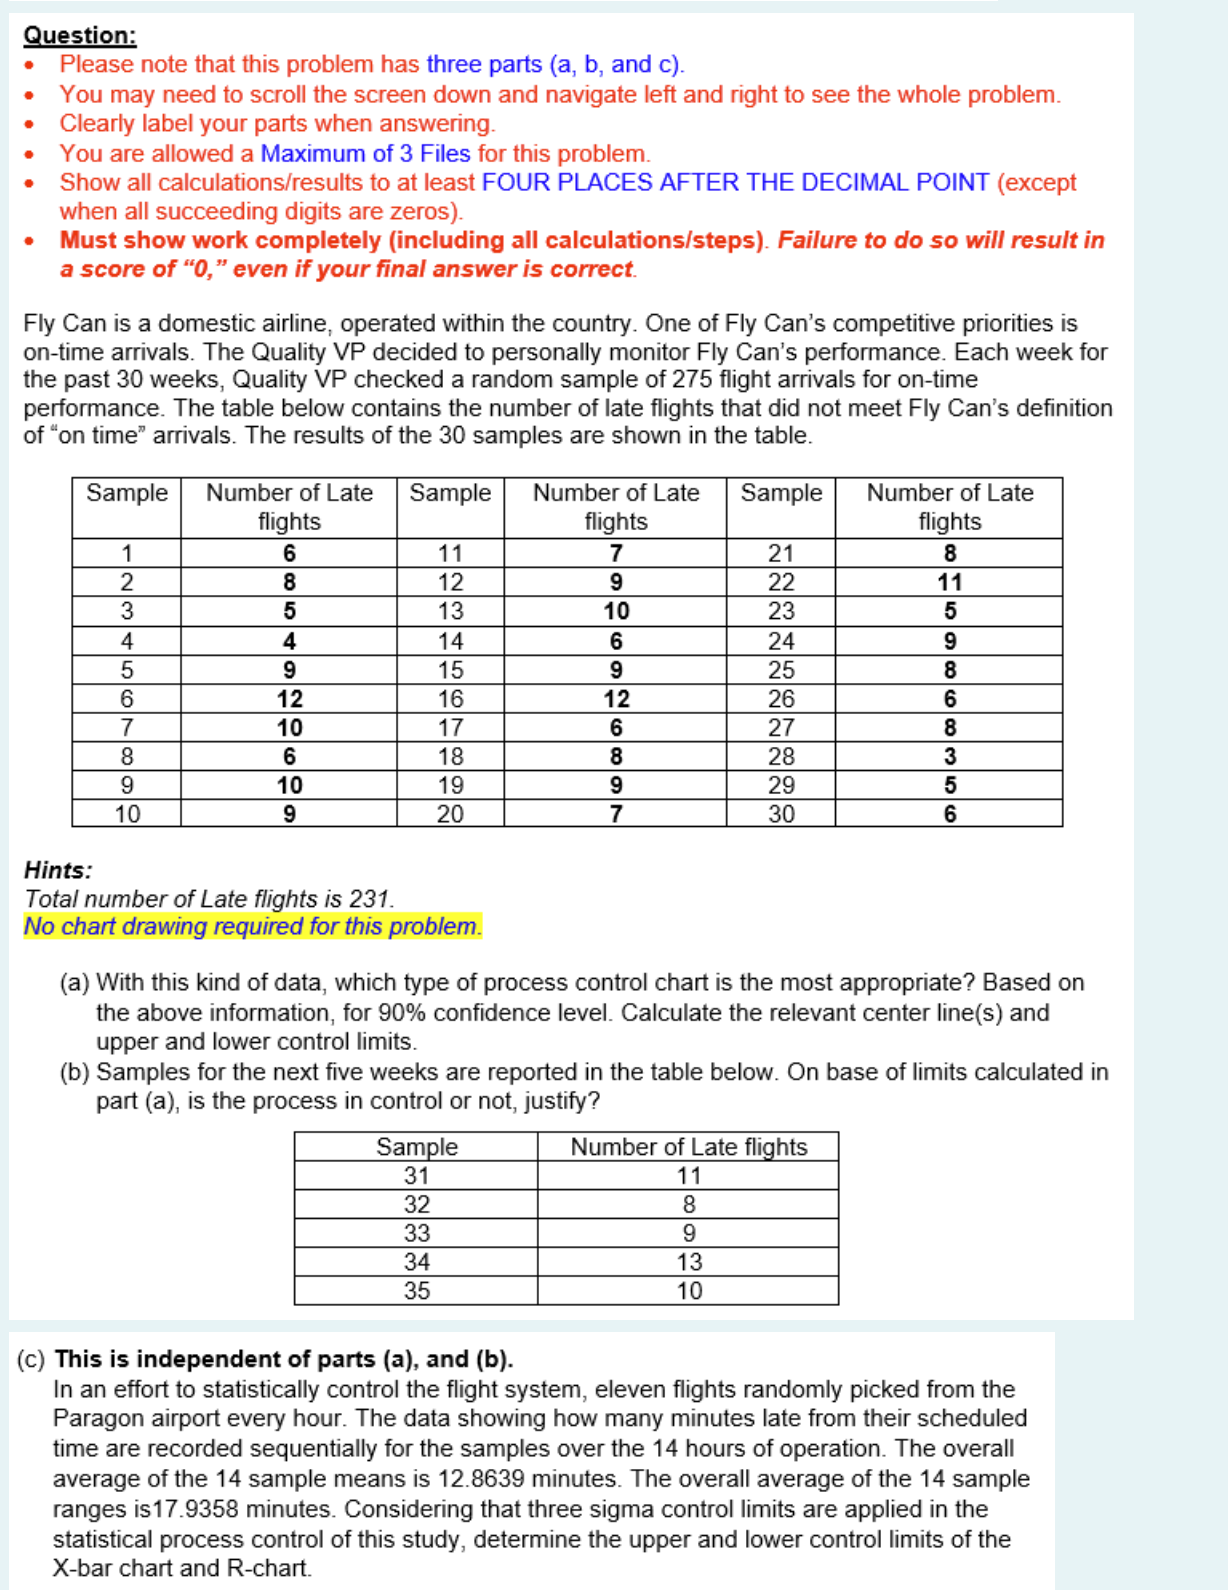
Fly Can is a domestic airline, operated within the country. One of Fly Can's competitive priorities is
ontime arrivals. The Quality VP decided to personally monitor Fly Can's performance. Each week for
the past weeks, Quality VP checked a random sample of flight arrivals for ontime
performance. The table below contains the number of late flights that did not meet Fly Can's definition
of on time" arrivals. The results of the samples are shown in the table.
Hints:
Total number of Late flights is
No chart drawing required for this problem.
a With this kind of data, which type of process control chart is the most appropriate? Based on
the above information, for confidence level. Calculate the relevant center lines and
upper and lower control limits
b Samples for the next five weeks are reported in the table below. On base of limits calculated in
part a is the process in control or not, justify?
c This is independent of parts a and b
In an effort to statistically control the flight system, eleven flights randomly picked from the
Paragon airport every hour. The data showing how many minutes late from their scheduled
time are recorded sequentially for the samples over the hours of operation. The overall
average of the sample means is minutes. The overall average of the sample
ranges is minutes. Considering that three sigma control limits are applied in the
statistical process control of this study, determine the upper and lower control limits of the
Xbar chart and Rchart. Please help with thhis show all your work, and do not just use an excel program to input the data, show ALL your wokr step by step.
Step by Step Solution
There are 3 Steps involved in it
1 Expert Approved Answer
Step: 1 Unlock

Question Has Been Solved by an Expert!
Get step-by-step solutions from verified subject matter experts
Step: 2 Unlock
Step: 3 Unlock