

Question: Question: Plot the following data and determine the pre - consolidation pressure and the modified compression index. table [ [ table [ [
Question:
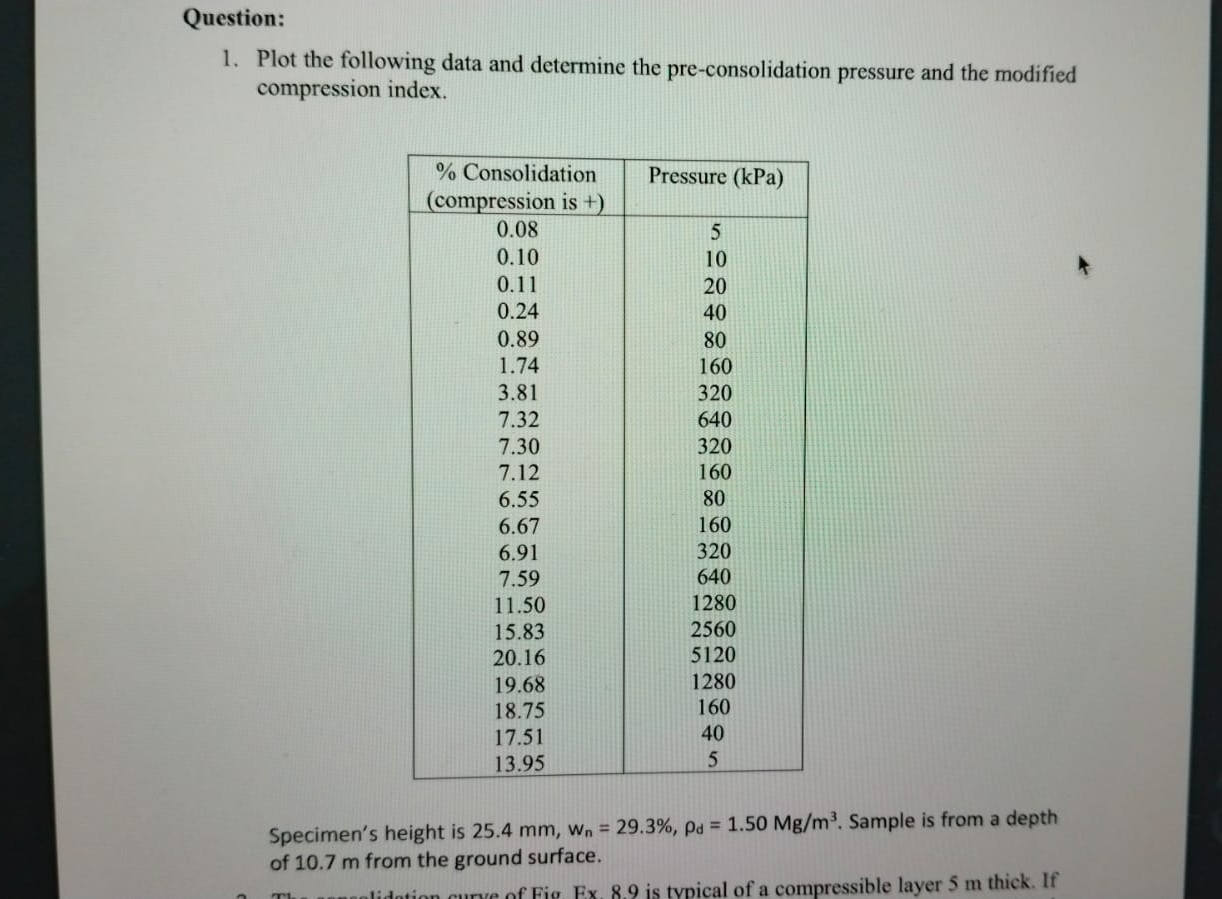
Plot the following data and determine the preconsolidation pressure and the modified compression index.
tabletable Consolidationcompression is Pressure kPa
Specimen's height is Sample is from a depth of m from the ground surface.
Step by Step Solution
There are 3 Steps involved in it
1 Expert Approved Answer
Step: 1 Unlock

Question Has Been Solved by an Expert!
Get step-by-step solutions from verified subject matter experts
Step: 2 Unlock
Step: 3 Unlock