

Question: Question: Plot the results for two other cases: r = 0.2 and r = 0.75. Show the plots on top of the results given for
Question: Plot the results for two other cases: r = 0.2 and r = 0.75. Show the plots on top of the results given for r = 0.5.
To the expert: Dont paste irrelevant answer. NO CODES. JUST THE PLOT IS NEEDED !!! USE THE INFORMATION THAT IS GIVEN FROM THE PROBLEM AND FIGURE TO PLOT THE RESULTS FOR R=0.2 AND R=0.75. SHOW ME THE PICTURES ON CHEGG.
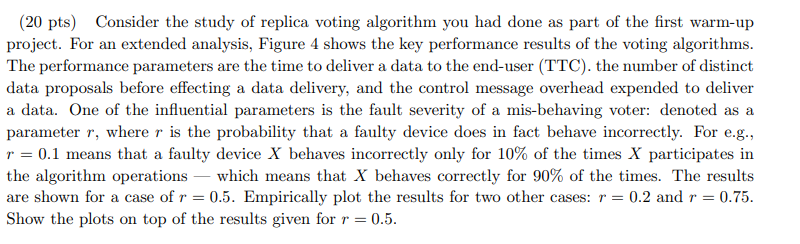
(20 pts) Consider the study of replica voting algorithm you had done as part of the first warm-up project. For an extended analysis, Figure 4 shows the key performance results of the voting algorithms. The performance parameters are the time to deliver a data to the end-user (TTC). the number of distinct data proposals before effecting a data delivery, and the control message overhead expended to deliver a data. One of the influential parameters is the fault severity of a mis-behaving voter: denoted as a parameter r, where r is the probability that a faulty device does in fact behave incorrectly. For e.g., r=0.1 means that a faulty device X behaves incorrectly only for 10% of the times X participates in the algorithm operations - which means that X behaves correctly for 90% of the times. The results are shown for a case of r=0.5. Empirically plot the results for two other cases: r=0.2 and r=0.75. Show the plots on top of the results given for r=0.5. Figure 4: Experimental performance results of replica voting algorithm
Step by Step Solution
There are 3 Steps involved in it

Get step-by-step solutions from verified subject matter experts