

Question: 5. (20 pts) Consider the study of replica voting algorithm you had done as part of the first warm-up project. For an extended analysis,
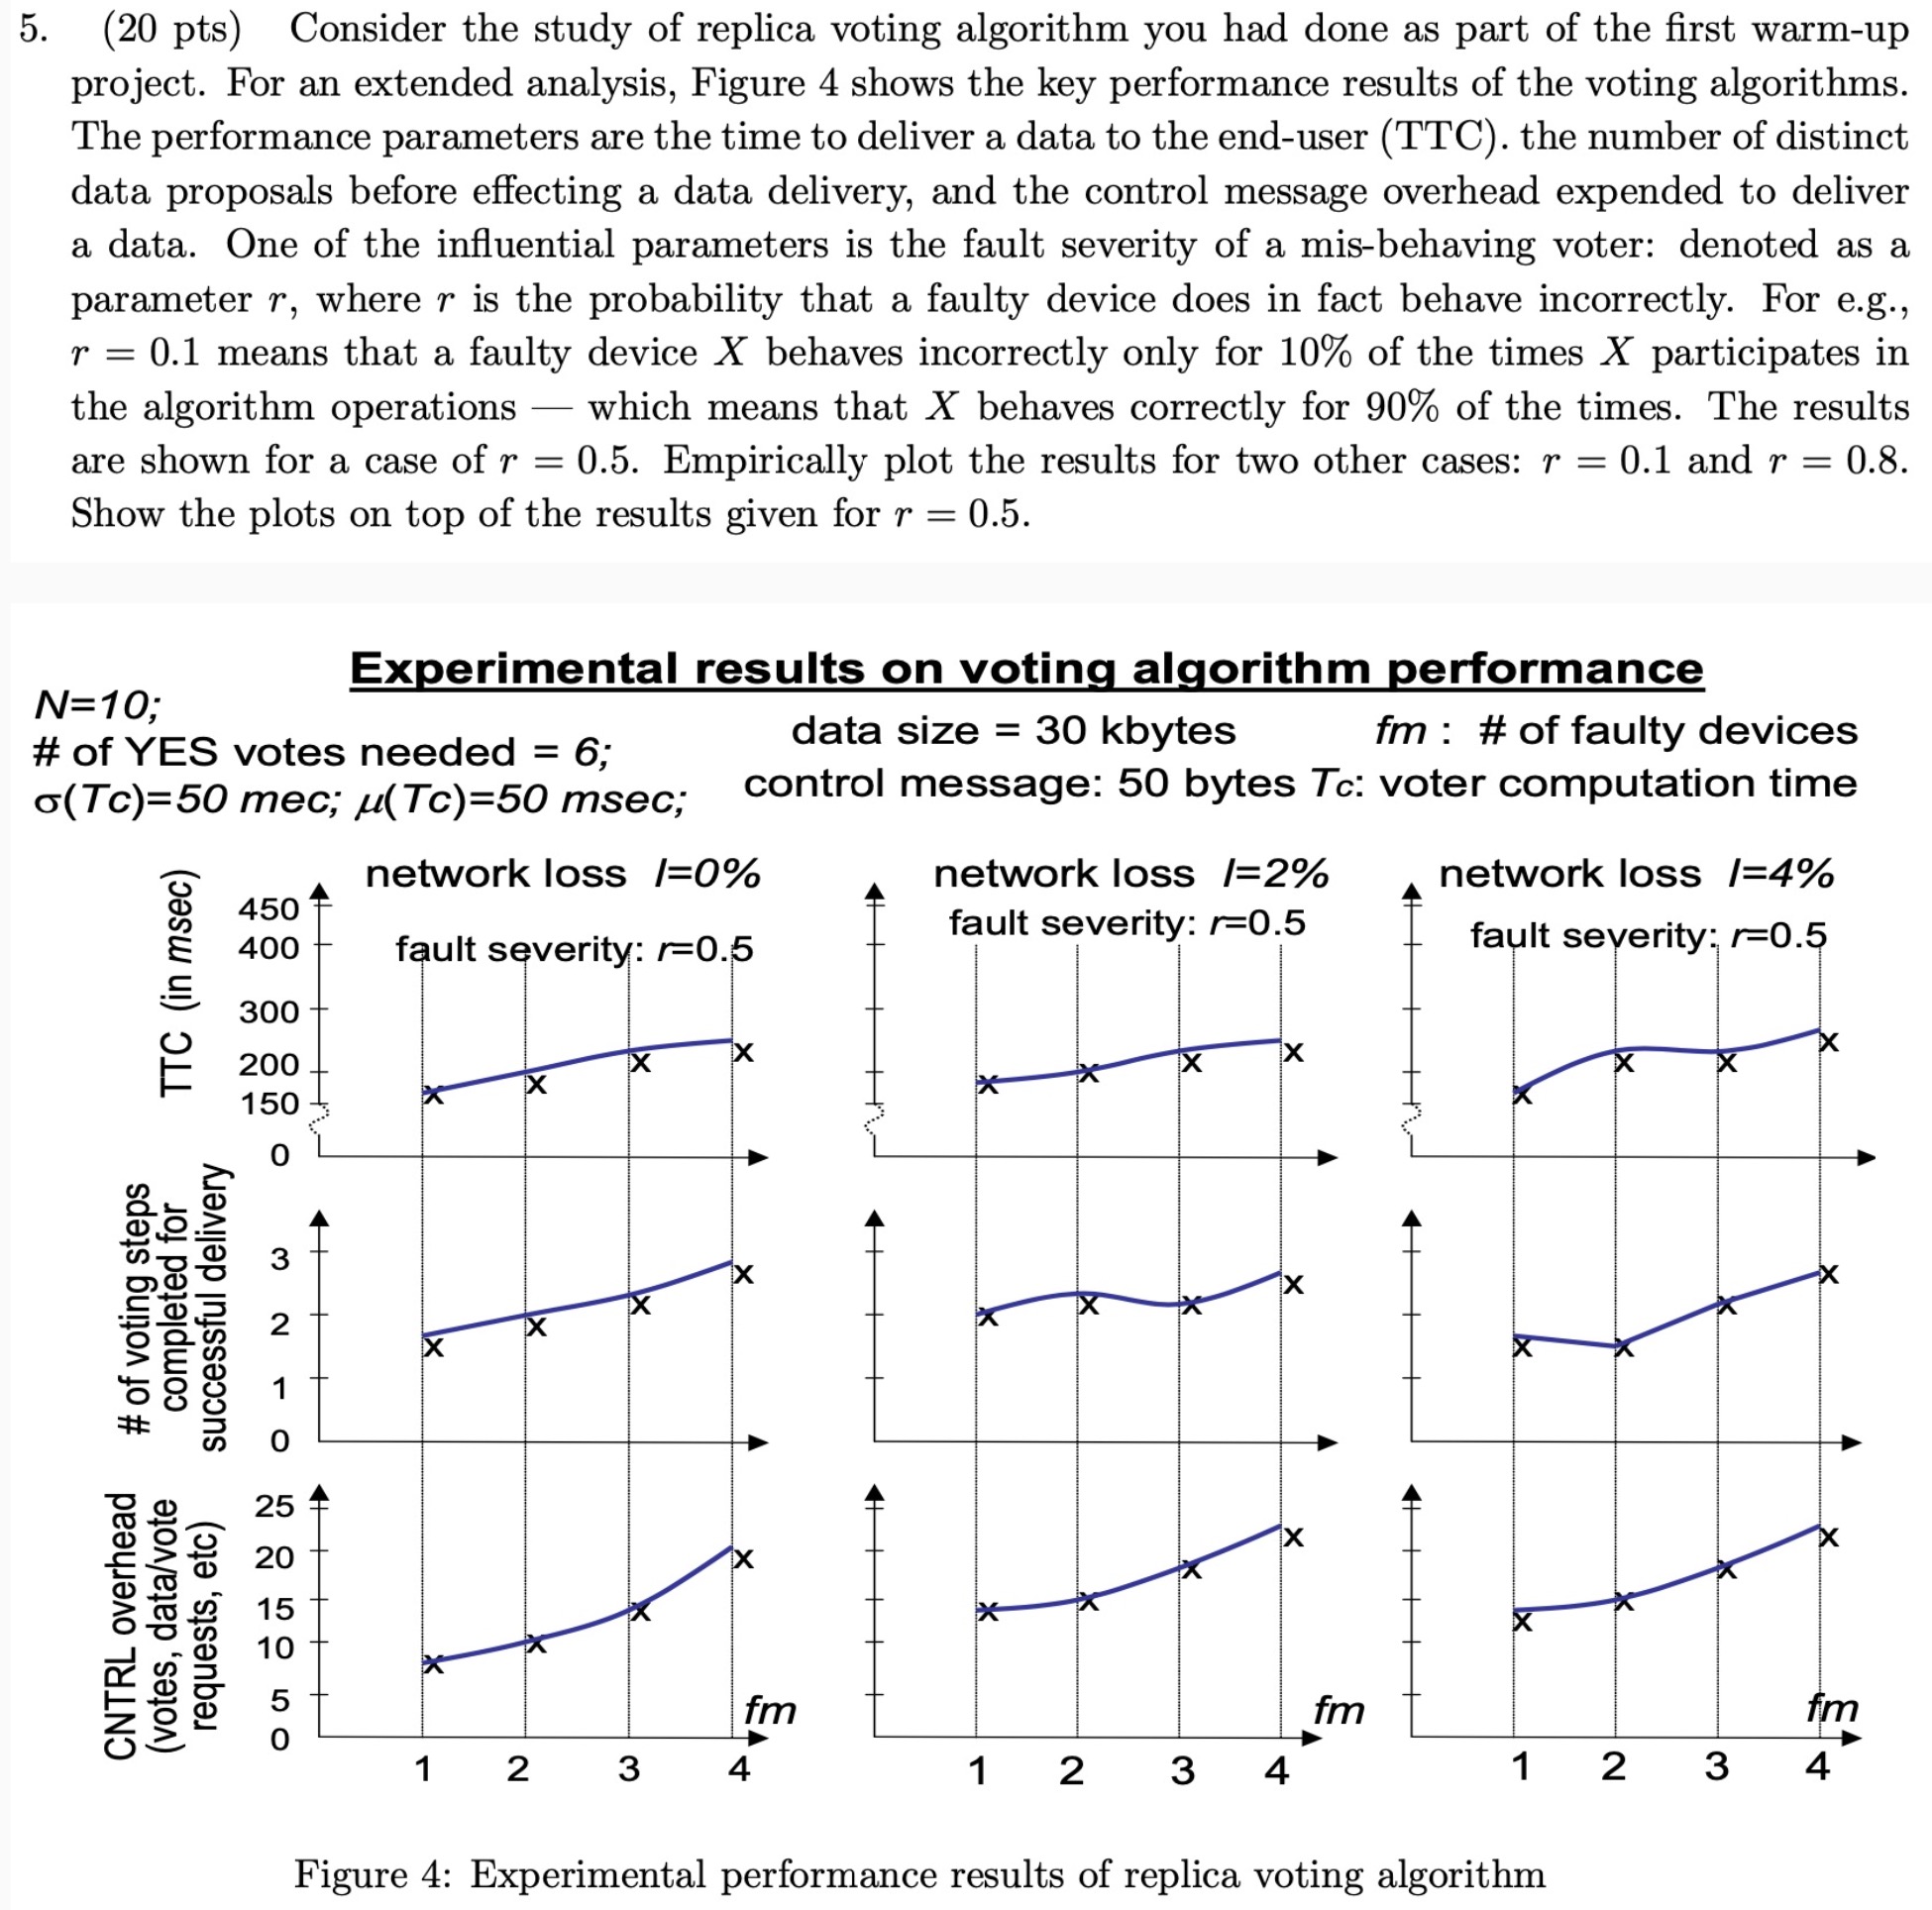
5. (20 pts) Consider the study of replica voting algorithm you had done as part of the first warm-up project. For an extended analysis, Figure 4 shows the key performance results of the voting algorithms. The performance parameters are the time to deliver a data to the end-user (TTC). the number of distinct data proposals before effecting a data delivery, and the control message overhead expended to deliver a data. One of the influential parameters is the fault severity of a mis-behaving voter: denoted as a parameter r, where r is the probability that a faulty device does in fact behave incorrectly. For e.g., r = 0.1 means that a faulty device X behaves incorrectly only for 10% of the times X participates in the algorithm operations which means that X behaves correctly for 90% of the times. The results are shown for a case of r = 0.5. Empirically plot the results for two other cases: r = 0.1 and r = : 0.8. Show the plots on top of the results given for r=0.5. N=10; # of YES votes needed = 6; o(Tc)=50 mec; (Tc)=50 msec; TTC (in msec) # of voting steps completed for successful delivery CNTRL overhead (votes, data/vote requests, etc) 450 400 300 200 150 O 2 1 O 21565 20 Experimental results on voting algorithm performance 10 network loss /=0% fault severity: r=0.5 1 X 1x X x data size = 30 kbytes fm : # of faulty devices control message: 50 bytes Tc: voter computation time 2 3 X fm 4 network loss /=2% fault severity: r=0.5 X X 1 2 3 4 fm network loss /=4% fault severity: r=0.5 1 Figure 4: Experimental performance results of replica voting algorithm 2 3 fm 4
Step by Step Solution
There are 3 Steps involved in it

Get step-by-step solutions from verified subject matter experts