

Question: Question Response What does this visualization show? How might these observations affect our risk assessment? Number of Securities on File Number of Securities on File
| Question | Response |
| What does this visualization show? |
|
| How might these observations affect our risk assessment? |
|
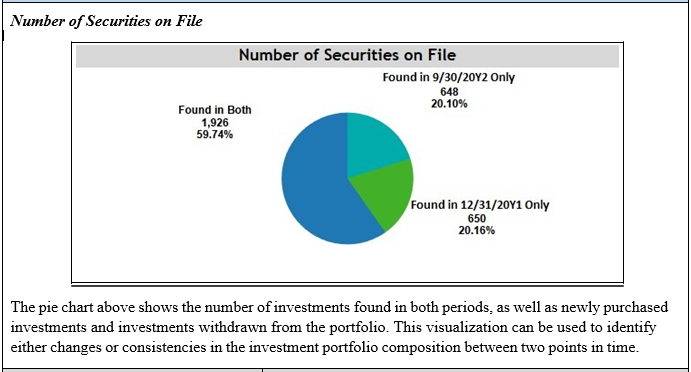
Number of Securities on File Number of Securities on File Found in 9/30/2022 Only Found in Both 20.10% 59.74% 648 1,926 Found in 12/31/20Y1 Only 650 20.16% The pie chart above shows the number of investments found in both periods, as well as newly purchased investments and investments withdrawn from the portfolio. This visualization can be used to identify either changes or consistencies in the investment portfolio composition between two points in time
Step by Step Solution
There are 3 Steps involved in it
1 Expert Approved Answer
Step: 1 Unlock

Question Has Been Solved by an Expert!
Get step-by-step solutions from verified subject matter experts
Step: 2 Unlock
Step: 3 Unlock