

Question: Question should be answered in Python 3. Linear regression model is described by equation: y = XB +E where y is the vector of dependent
 Question should be answered in Python
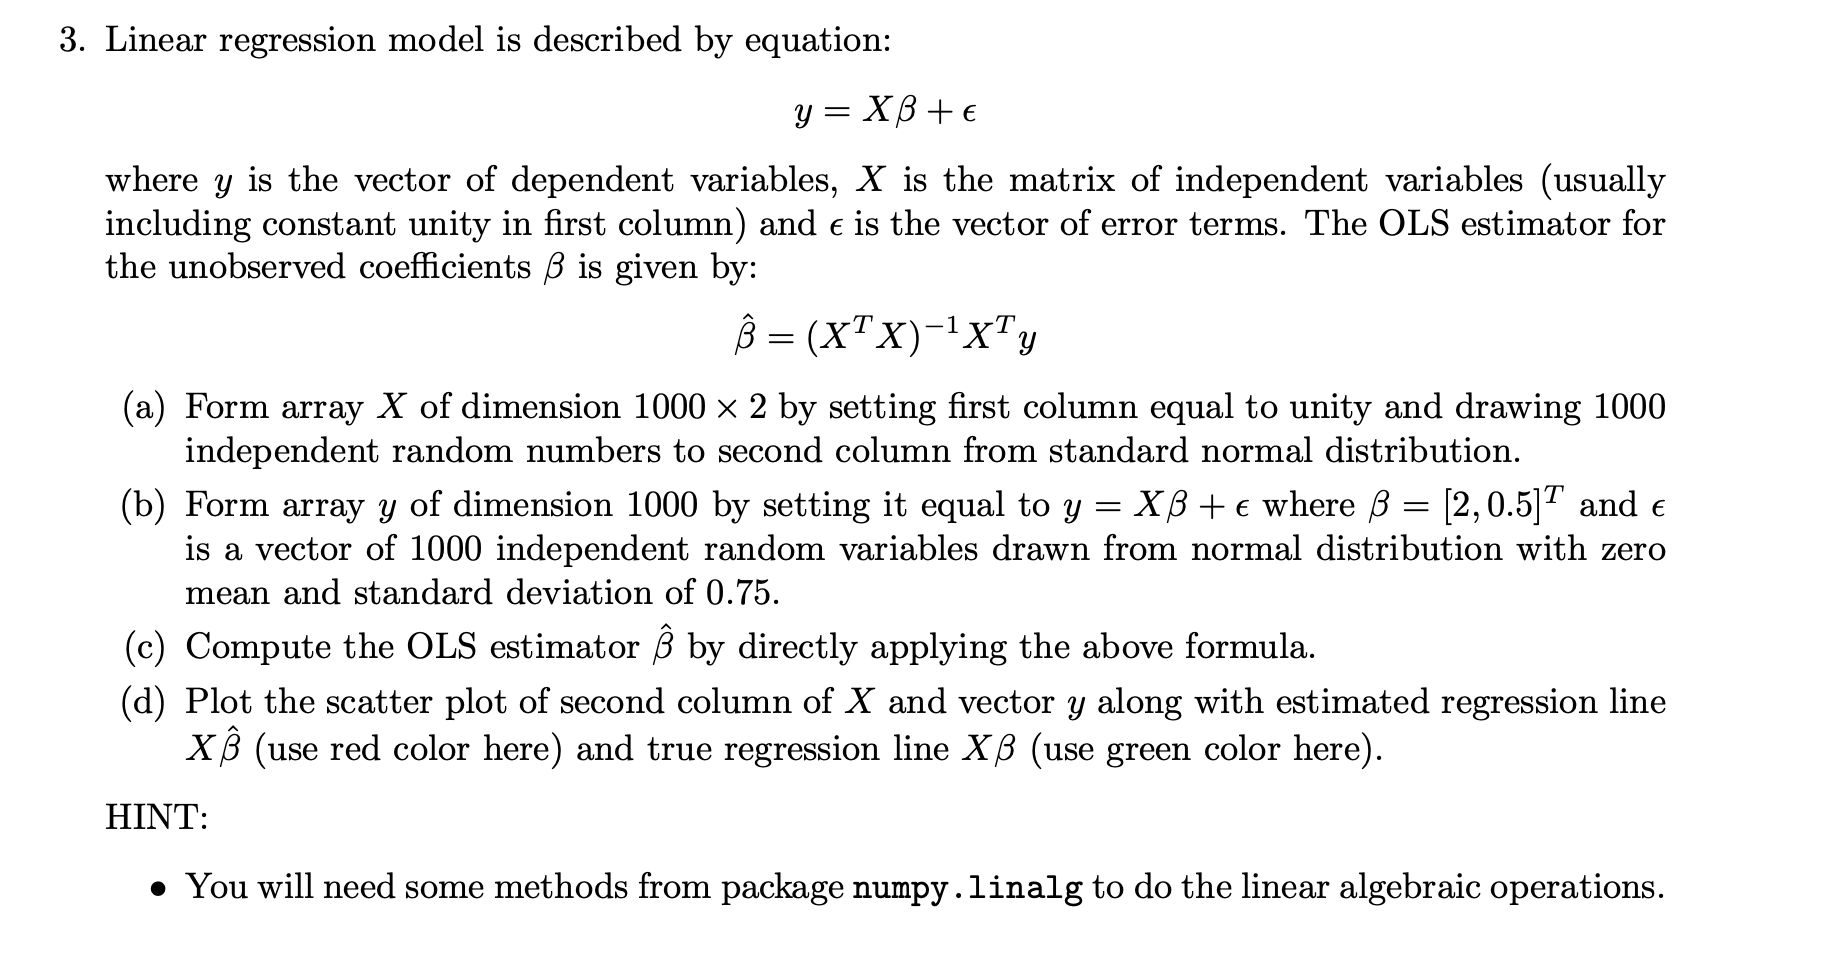
3. Linear regression model is described by equation: y = XB +E where y is the vector of dependent variables, X is the matrix of independent variables (usually including constant unity in first column) and e is the vector of error terms. The OLS estimator for the unobserved coefficients is given by: B =(x+x)-lxTg = - = (a) Form array X of dimension 1000 x 2 by setting first column equal to unity and drawing 1000 independent random numbers to second column from standard normal distribution. (b) Form array y of dimension 1000 by setting it equal to y XB + E where = [2,0.5]T and e is a vector of 1000 independent random variables drawn from normal distribution with zero mean and standard deviation of 0.75. (c) Compute the OLS estimator by directly applying the above formula. (d) Plot the scatter plot of second column of X and vector y along with estimated regression line y X (use red color here) and true regression line XB (use green color here). HINT: You will need some methods from package numpy.linalg to do the linear algebraic operations. 3. Linear regression model is described by equation: y = XB +E where y is the vector of dependent variables, X is the matrix of independent variables (usually including constant unity in first column) and e is the vector of error terms. The OLS estimator for the unobserved coefficients is given by: B =(x+x)-lxTg = - = (a) Form array X of dimension 1000 x 2 by setting first column equal to unity and drawing 1000 independent random numbers to second column from standard normal distribution. (b) Form array y of dimension 1000 by setting it equal to y XB + E where = [2,0.5]T and e is a vector of 1000 independent random variables drawn from normal distribution with zero mean and standard deviation of 0.75. (c) Compute the OLS estimator by directly applying the above formula. (d) Plot the scatter plot of second column of X and vector y along with estimated regression line y X (use red color here) and true regression line XB (use green color here). HINT: You will need some methods from package numpy.linalg to do the linear algebraic operations
Step by Step Solution
There are 3 Steps involved in it

Get step-by-step solutions from verified subject matter experts