

Question: Question: Summarize your results from Steps 1-11 in a report. The report should explain and interpret the results in ways that are understandable to someone
Question: Summarize your results from Steps 1-11 in a report. The report should explain and interpret the results in ways that are understandable to someone who does not know statistics.
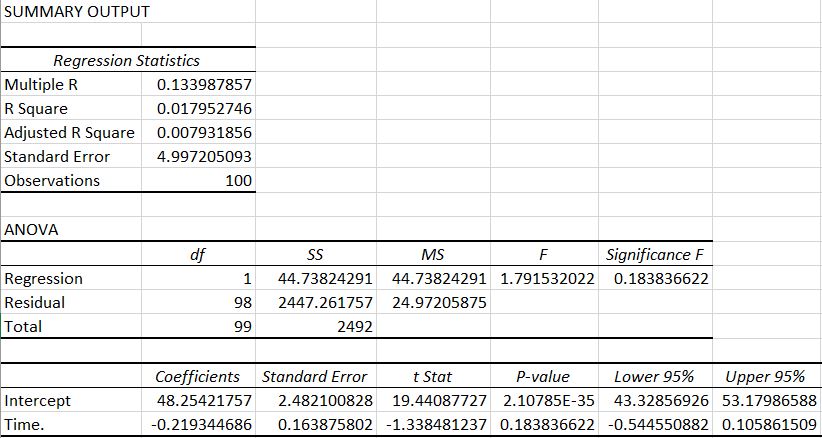
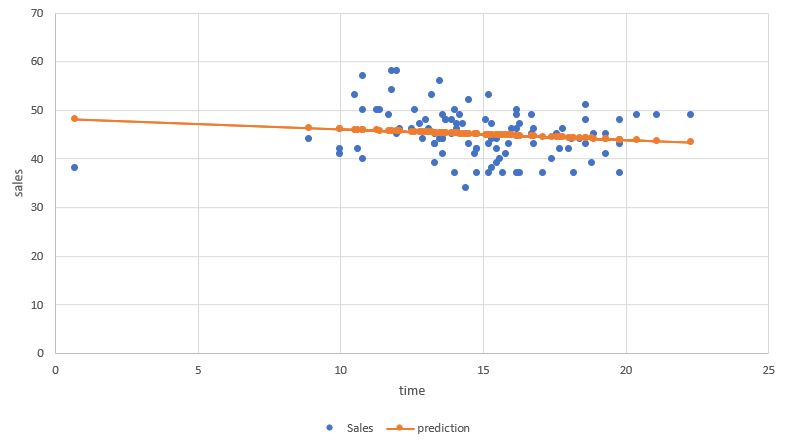
Step 1 scatterplot: For the dependent variable I used (Y "Sales") and the selected independent variable I chose (X2 "Time").
\f\f
Step by Step Solution
There are 3 Steps involved in it
1 Expert Approved Answer
Step: 1 Unlock

Question Has Been Solved by an Expert!
Get step-by-step solutions from verified subject matter experts
Step: 2 Unlock
Step: 3 Unlock