

Question: QUESTION T Video ?-? | Two-Tailed Test Video ?-3 | Left-Tailed Test According to the National Health Statistics Reports. the mean height for U.S. men
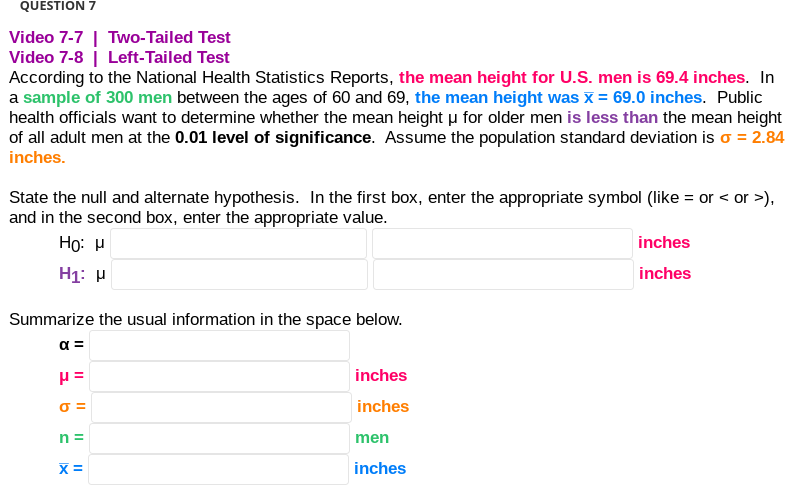
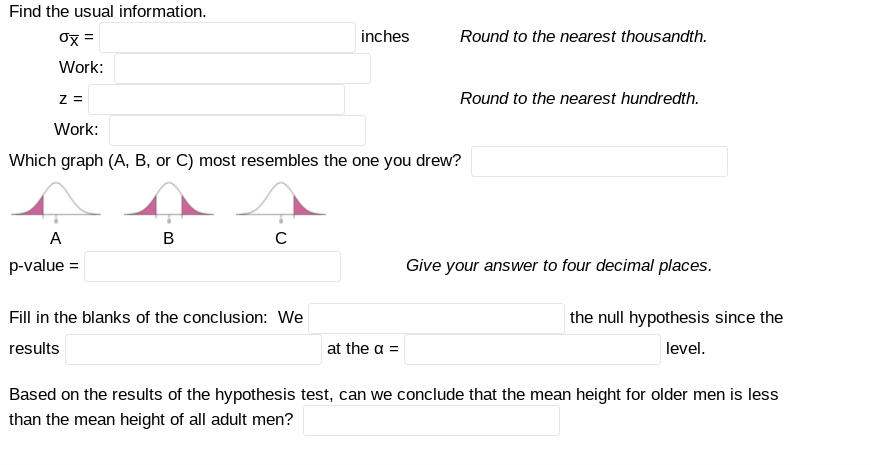
QUESTION T Video ?-? | Two-Tailed Test Video ?-3 | Left-Tailed Test According to the National Health Statistics Reports. the mean height for U.S. men is 69.4 inches. In a sample of 300 men between the ages of ED and 59. the mean height was i = 69.0 inches. Public health officials want to determine whether the mean height [.1 for older men is less than the mean height of all adult men at the 0111 level of significance. Assume the population standard deviation is o = 2.34 inches. State the null and alternate hypothesis. In the first box. enter the appropriate symbol (like = or -= or 2-). and in the second box, enter the appropriate value. Hg: u H1: u Summarize the usual information in the space below. a : p = inches cr = inches n = men i = inches inches inches Find the usual information. oi = inches Round to the nearest thousandth. = Round to the nearest hundredth. Which graph (A. B. or C) most resembles the one you drew? !- I l- .. B C p-I-ralue = Give your answer to four decimal places. Fill in the blanks of the conclusion: We the null hypothesis since the results at the d = level. Based on the results of the hypothesis test. can we conclude that the mean height for older men is less than the mean height of all adult men
Step by Step Solution
There are 3 Steps involved in it

Get step-by-step solutions from verified subject matter experts