

Question: Question: The following data set is derived from two different analytical methods analyzing the same samples. The samples contain different concentrations of acetylsalicylic acid (ASA)
Question:
The following data set is derived from two different analytical methods analyzing the same samples. The samples contain different concentrations of acetylsalicylic acid (ASA) added to blood. The two analytical methods are chromatographic methods and only differ in the oven temperature (35 C vs. 45 C) while all other parameters are held constant. Each sample is analyzed 3 times.
Spiked ASA concentration
(in mg/L) Method 1 (35C) )Method 2(45 C)
0.25 20 18 21 25 23 28
0.5 33 31 32 41 38 39
1.0 44 48 45 91 87 95
2.0 71 75 73 136 145 139
4.0 125 119 131 181 172 175
A........Plot the two linear regression models on one set of axes. Then calculate coefficients of determination for each of the two methods (note: you can use any program that is able to calculate simple linear regression models. If you do, please provide the data file in addition to the answer). Which of the methods would you prefer for the analysis of ASA samples over a concentration range of 0.25 to 4 mg/L?
B. Calculate the 95% confidence intervals for the slopes of each of the two regression models. Do these confidence intervals overlap? What conclusions can you draw from the confidence intervals?
C. Test the hypothesis that the two slopes are not significantly different from each other. In order to do so, consider that the each of the slopes is a variable that has a mean and a standard deviation -
PLEASE SHOW ALL STEPS AND EXPLANATION FOR EACH PART>thanks
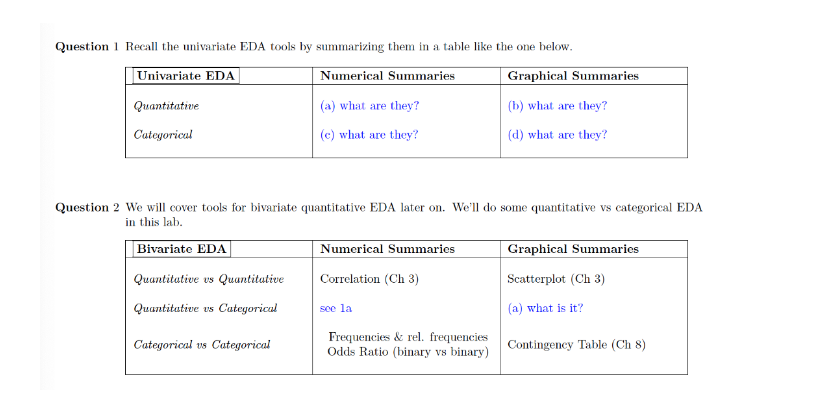
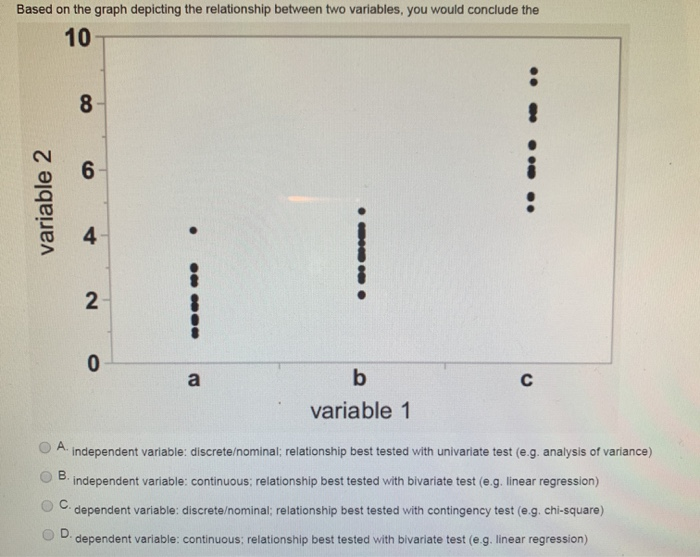
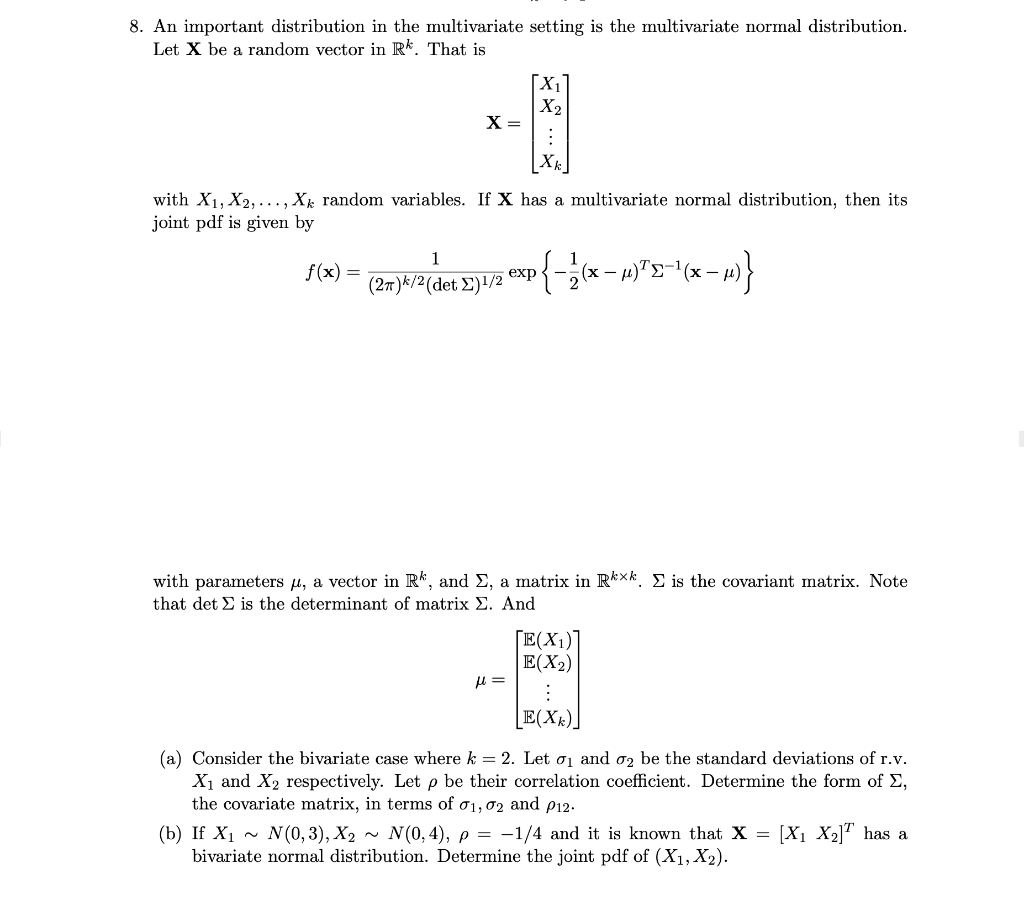

Question 1 Recall the univariate EDA tools by summarizing them in a table like the one below. Univariate EDA Numerical Summaries Graphical Summaries Quantitative (a) what are they? (b) what are they? Categorical (c) what are they? (d) what are they? Question 2 We will cover tools for bivariate quantitative EDA later on. We'll do some quantitative vs categorical EDA in this lab. Bivariate EDA Numerical Summaries Graphical Summaries Quantitative us Quantitative Correlation (Ch 3) Scatterplot (Ch 3) Quantitative us Categorical soe la (a) what is it? Categorical us Categorical Frequencies & rel. frequencies Odds Ratio (binary vs binary) Contingency Table (Ch 8)Based on the graph depicting the relationship between two variables, you would conclude the 10 .. Co 6 .. .. . variable 2 4 . . . 2 O a b C variable 1 A. independent variable: discreteominal; relationship best tested with univariate test (e.g. analysis of variance) O B. independent variable: continuous; relationship best tested with bivariate test (e.g. linear regression) O C. dependent variable: discreteominal; relationship best tested with contingency test (e.g. chi-square) O D. dependent variable: continuous; relationship best tested with bivariate test (e.g. linear regression)3. An iniportent distribution in the multivariate setting is the multivariate normal distribution. Let K be a random vector in El\". That is with X1, X2, . . . , X1, random variables. If X has a multivariate normal distribution, then its joint pdf is given by 1 1 _ ax):(Wwetmme 2e \")1": lacm} with parameters a, a. vector in R\Question 31 1 pts A correlation heat map is best used for: O Bivariate data when both columns are numeric Multivariate data when all columns are ordinal Multivariate data when all columns are nominal Multivariate data when all columns are numeric
Step by Step Solution
There are 3 Steps involved in it

Get step-by-step solutions from verified subject matter experts