

Question: Question: The following data set is derived from two different analytical methods analyzing the same samples. The samples contain different concentrations of acetylsalicylic acid (ASA)
Question:
The following data set is derived from two different analytical methods analyzing the same samples. The samples contain different concentrations of acetylsalicylic acid (ASA) added to blood. The two analytical methods are chromatographic methods and only differ in the oven temperature (35 C vs. 45 C) while all other parameters are held constant. Each sample is analyzed 3 times.
Spiked ASA concentration
(in mg/L) Method 1 (35C) )Method 2(45 C)
0.25 20 18 21 25 23 28
0.5 33 31 32 41 38 39
1.0 44 48 45 91 87 95
2.0 71 75 73 136 145 139
4.0 125 119 131 181 172 175
A........Plot the two linear regression models on one set of axes. Then calculate coefficients of determination for each of the two methods (note: you can use any program that is able to calculate simple linear regression models. If you do, please provide the data file in addition to the answer). Which of the methods would you prefer for the analysis of ASA samples over a concentration range of 0.25 to 4 mg/L?
B. Calculate the 95% confidence intervals for the slopes of each of the two regression models. Do these confidence intervals overlap? What conclusions can you draw from the confidence intervals?
C. Test the hypothesis that the two slopes are not significantly different from each other. In order to do so, consider that the each of the slopes is a variable that has a mean and a standard deviation -
PLEASE SHOW ALL STEPS AND EXPLANATION FOR EACH PART>thanks
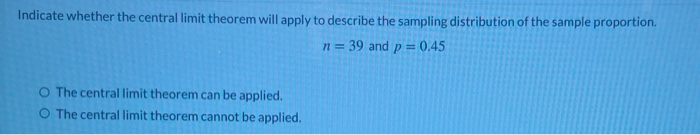
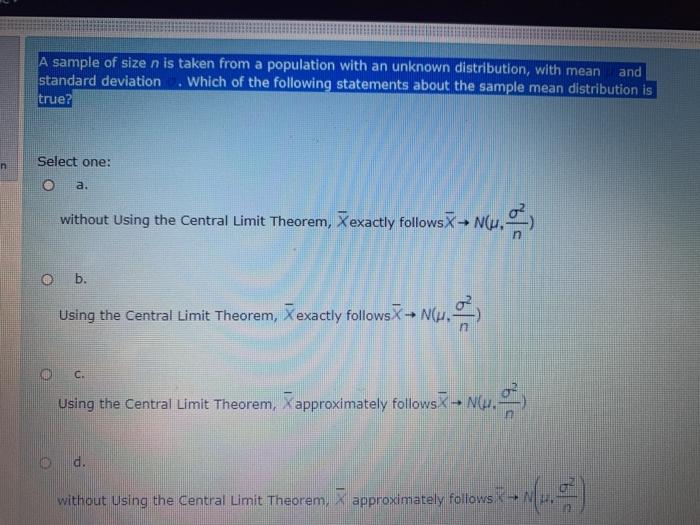
Indicate whether the central limit theorem will apply to describe the sampling distribution of the sample proportion. 1 = 39 and p = 0.45 O The central limit theorem can be applied. O The central limit theorem cannot be applied.A sample of size n is taken from a population with an unknown distribution, with mean and standard deviation . Which of the following statements about the sample mean distribution is true? Select one: O a. without Using the Central Limit Theorem, Xexactly followsX- Nu. 0 b. Using the Central Limit Theorem, Xexactly followsX - N(J.-) C. Using the Central Limit Theorem, Xapproximately follows
Step by Step Solution
There are 3 Steps involved in it

Get step-by-step solutions from verified subject matter experts