

Question: Question: Use the following sample data, taken from the next time period, to determine if the process is In Control Or Out of Control. Fogarty
Question:
Use the following sample data, taken from the next time period, to determine if the process is "In Control" Or "Out of Control".
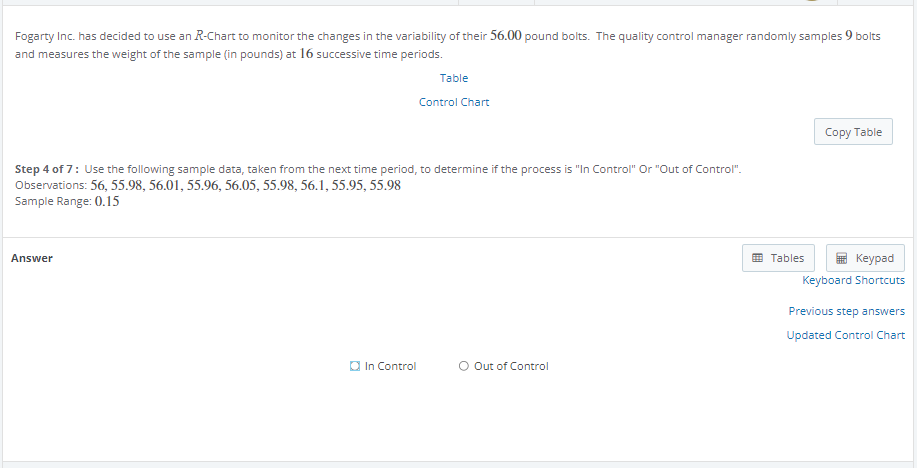
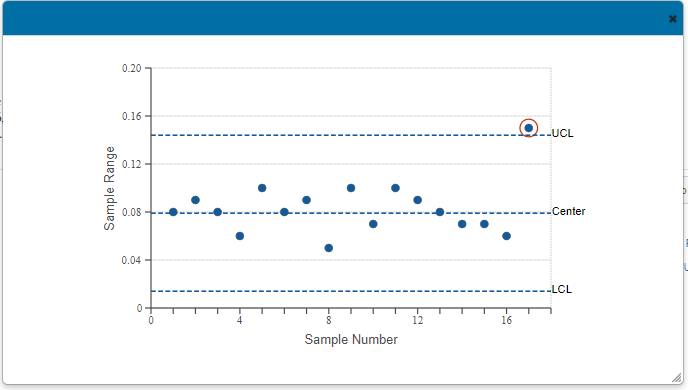
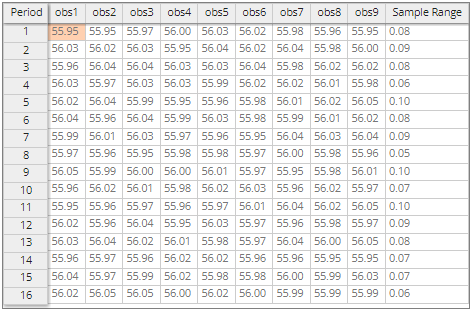
Fogarty Inc. has decided to use an R-Chart to monitor the changes in the variability of their 5-6.0\" pound Dolls. The quality control manager randomly samples 9 bolts and measures the weight ofthe sample {in pounds} at 16 successive time periods. Table Control Chart Copy Table Step 4 of 3': Use the following sample datar taken from the next time period, to determine if the process is "In Control" Or "Clut of Control". Observations 56, 55.98, 56.0], 55.96, 56.05, 55.98, 56.] , 55.95, 55.93 Sample Range: 0.15 Answer l E Tables ' l E Keypad Keyboard Shortcuts Previous step answers Updated Control Ch art [.1 In Control 0 Out ofControl \fPeriod obs1 obs2 obs3 obs4 obs5 0b56 obs7 obsB obs9 Sample Range 55.95 55.95 55.97 56.00 56.03 56.02 55.98 55.96 55.95 0.08 2 56.03 56.02 56.03 55.95 56.04 56.02 56.04 55.98 56.00 0.09 3 55.96 56.04 56.04 56.03 56.03 56.04 55.98 56.02 56.02 0.08 4 56.03 55.97 56.03 56.03 55.99 56.02 56.02 56.01 55.98 0.06 in 56.02 56.04 55.99 55.95 55.96 55.98 56.01 56.02 56.05 0.10 6 56.04 55.96 56.04 55.99 56.03 55.98 55.99 56.01 56.02 0.08 55.99 56.01 56.03 55.97 55.96 55.95 56.04 56.03 56.04 0.09 55.97 55.96 55.95 55.98 55.98 55.97 56.00 55.98 55.96 0.05 LO 56.05 55.99 56.00 56.00 56.01 55.97 55.95 55.98 56.01 0.10 10 55.96 56.02 56.01 55.98 56.02 56.03 55.96 56.02 55.97 0.07 11 55.95 55.96 55.97 55.96 55.97 56.01 56.04 56.02 56.05 0.10 12 56.02 55.96 56.04 55.95 56.03 55.97 55.96 55.98 55.97 0.09 13 56.03 56.04 56.02 56.01 55.98 55.97 56.04 56.00 56.05 0.08 14 55.96 55.97 55.96 56.02 56.02 55.96 55.96 55.95 55.95 0.07 15 56.04 55.97 55.99 56.02 55.98 55.98 56.00 55.99 56.03 0.07 16 56.02 56.05 56.05 56.00 56.02 56.00 55.99 55.99 55.99 0.06
Step by Step Solution
There are 3 Steps involved in it

Get step-by-step solutions from verified subject matter experts