

Question: help please!! Hutcheson & Gregory inc. has decided to use an R-Chart to monitor the changes in the variability of their 72.00 pound steel handles.
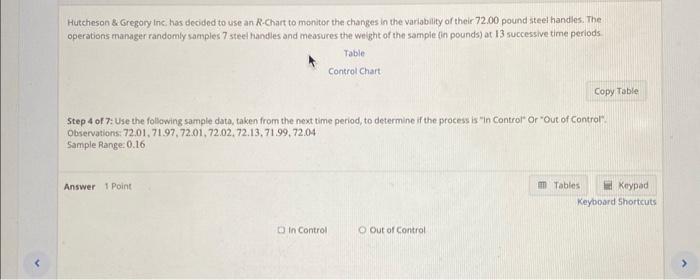
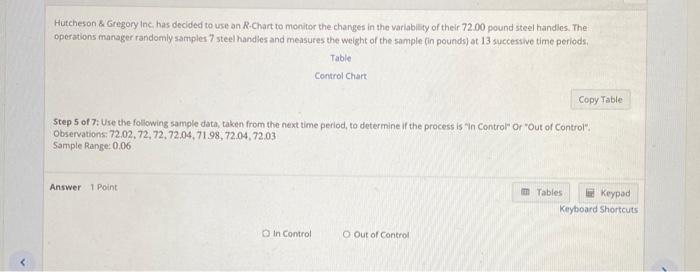
Hutcheson \& Gregory inc. has decided to use an R-Chart to monitor the changes in the variability of their 72.00 pound steel handles. The Table Control Chart Step 4 of 7: Use the following sample data, taken from the next time period, to determine if the process is "in Control" Or "Out of Control". Observations: 72.01,71.97,72.01,72.02,72.13,71.99,72.04 Sample Range: 0.16 Hutcheson & Gregory Inc, has decided to use an R-Chart to monitor the changes in the variability of their 72.00 pound steel handles. The operations manager randomly samples 7 steel handies and measures the weight of the sample (in pocinds) at 13 succerthe time periods Table Control Chart Step 5 of 7: Use the following sample data, taken from the next time period, to determine if the process is "in Control" or "Out of Control": Observations. 72.02,72,72,72.04,71.98,72.04,72.03 Somple Range: 0.06
Step by Step Solution
There are 3 Steps involved in it

Get step-by-step solutions from verified subject matter experts