

Question: Question We have a process as shown in the right figure. ( M 1 - M 4 are the names for four machines. The numbers
Question
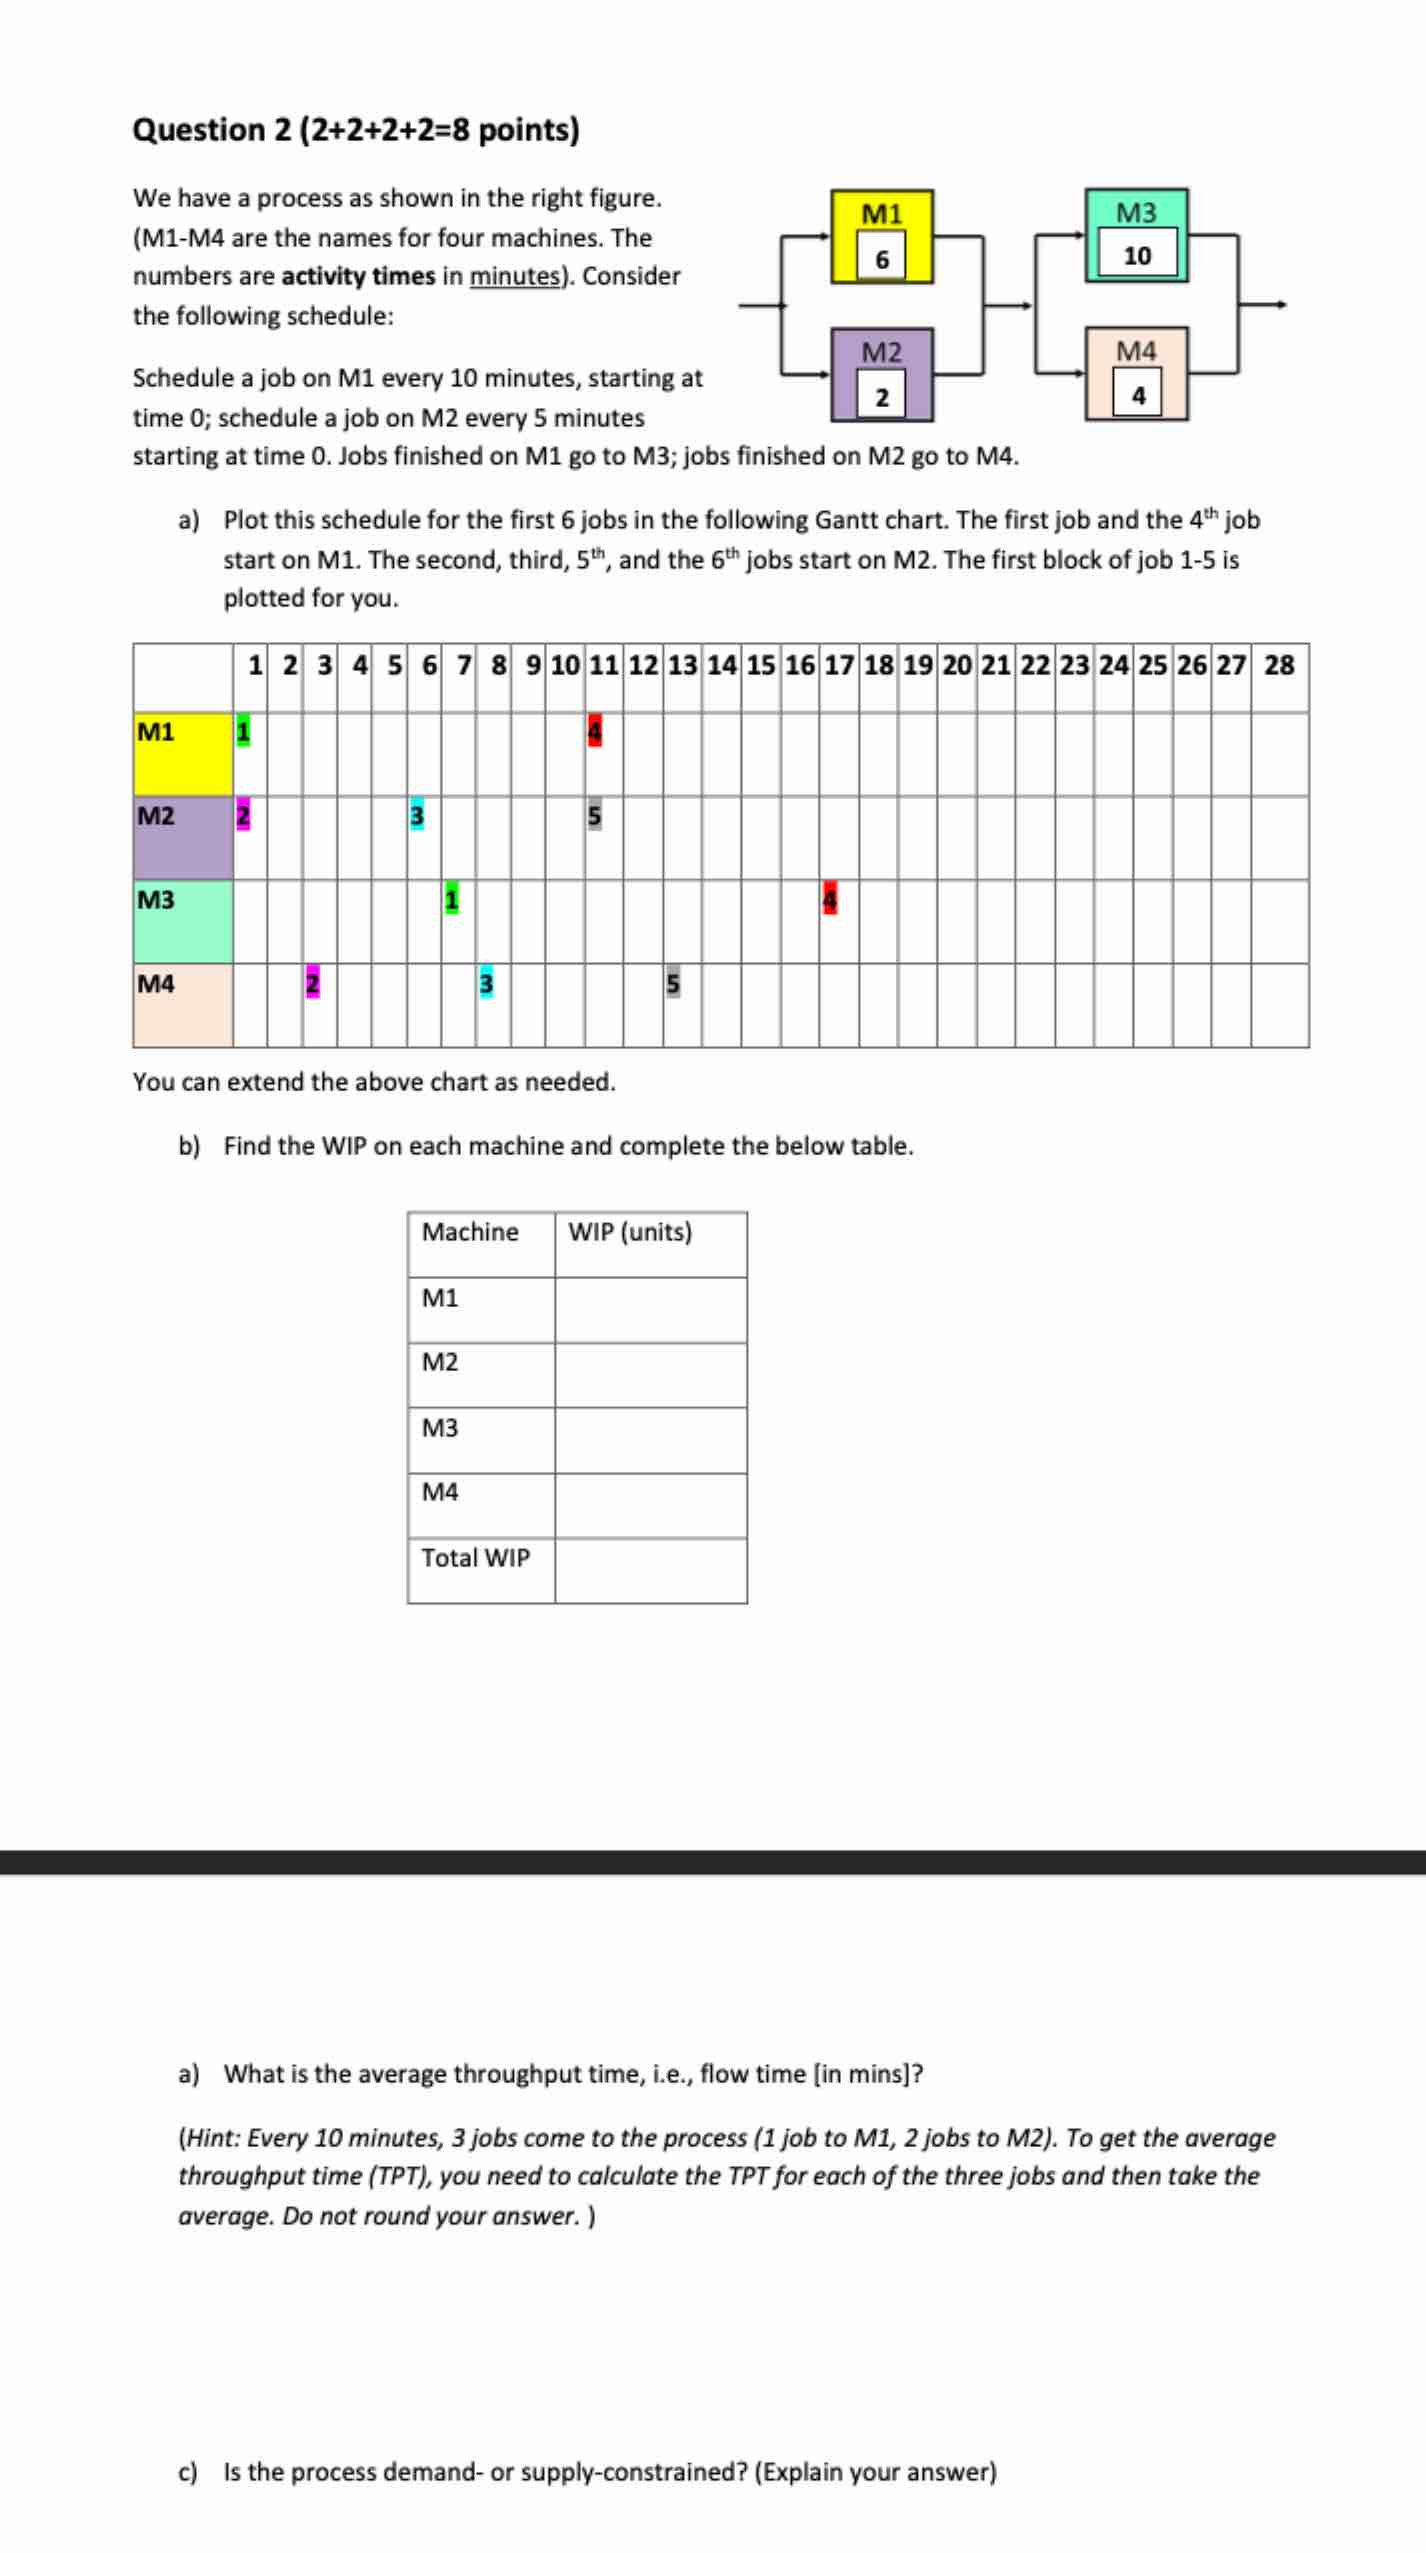
We have a process as shown in the right figure. MM are the names for four machines. The numbers are activity times in minutes Consider the following schedule:
Schedule a job on M every minutes, starting a time ; schedule a job on M every minutes starting at time Jobs finished on M go to M; juvs inimieu uli ivic gu iv ivis.
a Plot this schedule for the first jobs in the following Gantt chart. The first job and the text th job start on M The second, third, text th and the text th jobs start on M The first block of job is plotted for you.
You can extend the above chart as needed.
b Find the WIP on each machine and complete the below table.
a What is the average throughput time, ie flow time in mins
Hint: Every minutes, jobs come to the process job to M jobs to M To get the average throughput time TPT you need to calculate the TPT for each of the three jobs and then take the average. Do not round your answer.
c Is the process demand or supplyconstrained? Explain your answer
Step by Step Solution
There are 3 Steps involved in it
1 Expert Approved Answer
Step: 1 Unlock

Question Has Been Solved by an Expert!
Get step-by-step solutions from verified subject matter experts
Step: 2 Unlock
Step: 3 Unlock