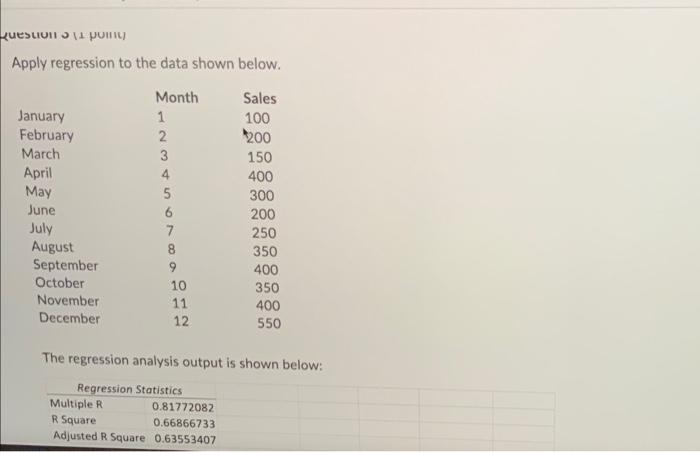
Question: questioni pom Apply regression to the data shown below. Month Sales January 1 100 February 2 200 March 3 150 April 4 400 May 5

questioni pom Apply regression to the data shown
questioni pom Apply regression to the data shown below. Month Sales January 1 100 February 2 200 March 3 150 April 4 400 May 5 300 June 6 200 July 7 250 August 8 350 September 9 400 October 10 350 November 11 400 December 12 550 The regression analysis output is shown below: Regression Statistics Multiple R 0.81772082 R Square 0.66866733 Adjusted R Square 0.63553407 The regression analysis output is shown below: Regression Statistics Multiple R 0.81772082 R Square 0.66866733 Adjusted R Square 0.63553407 Standard Error 77.716912 Observations 12 ANOVA df Regression Residual Total SS MS F Significance F 1 121892.4825 121892.5 20.18115 0.00115672 10 60399.18415 6039.918 11 182291.6667 Intercept Month Coefficients Standard Error t Stat P-value Lower 95% Upper 95% 114.393939 47.83145288 2.391605 0.037855 7.81882089 220.9691 29.1958042 6.499014672 4.492343 0.001157 14.7150971 43.67651 What is the forecast for next January's sales?(choose the closest answer up to 1 decimal place) 1600

Step by Step Solution

There are 3 Steps involved in it

1 Expert Approved Answer
Step: 1 Unlock blur-text-image
Question Has Been Solved by an Expert!

Get step-by-step solutions from verified subject matter experts

Step: 2 Unlock
Step: 3 Unlock

Students Have Also Explored These Related General Management Questions!